TESLA I Its not only EV Cars. Elon Musk predicting 1000% growthThis is not a short-term trade as you know from me on FX, Crypto and Indices. This is buy and hold investment. I got already good bag of share and Im still adding without trying to time if perfectly, but now I think its time to buy bigger positions.
Tesla is my 3rd biggest position after the Bitcoin and Strategy (MicroStrategy). Many people see it only as an EV cars company, but it's not all what they do, just read bellow to see why I see a huge potential in this company.
📍 Why Tesla is Considered a Top Investment
Tesla stands out as a leading player in the EV market, with a strong brand and a history of delivering innovative products. In 2024, it produced about 459,000 vehicles and delivered over 495,000 in the fourth quarter alone, showcasing its ability to meet growing demand Tesla Fourth Quarter 2024 Production, Deliveries & Deployments.
💾Financially, Tesla reported $97,690 million in total revenue for 2024, with the automotive segment contributing $87,604 million and energy solutions adding $10,086 million Tesla, Inc. Annual Report on Form 10-K for 2024. This diversification into energy, alongside investments in autonomous driving, positions Tesla for long-term growth, making it attractive for investors seeking exposure to future trends in sustainability and technology.
📍 What Tesla Does Beyond EV Cars
Beyond EVs, Tesla is deeply involved in energy solutions:
📍 Solar Products: Offers solar panels and solar roofs for clean energy generation.
📍 Energy Storage: Provides Powerwall for homes and Megapack for large-scale projects, helping stabilize grids and manage energy costs.
📍 Charging Infrastructure : Operates a network of Supercharger stations, increasingly open to other EVs.
Services: Includes vehicle maintenance through service centers and body shops.
📍 Robotaxi: Plans to launch a fully autonomous ride-hailing service in June 2025 in Austin, Texas, potentially opening new revenue streams Tesla's robotaxis by June? Musk turns to Texas for hands-off regulation.
📍 Tesla Optimus: Developing a general-purpose robotic humanoid for tasks like household chores or industrial work, which could lead to new markets.
This expansion into energy and services, along with unexpected ventures like Robotaxi and Tesla Optimus, enhances Tesla's role in the transition to sustainable energy and technology, offering benefits like grid stability and potential robotics applications.
The growth in the energy segment, with a 67% increase from 2023 to 2024, highlights Tesla's expanding role in sustainability, potentially attracting investors focused on long-term trends. Additionally, Tesla's commitment to innovation, particularly in autonomous driving technology, is noteworthy. The company is developing features like Full Self-Driving (FSD), which could open new revenue streams, such as robotaxi services, enhancing its investment appeal.
🤔I think Optimus and Robotaxi will exceed rapidly exceed their EV cars revenue. Elon musk is predicing over 1000% growth in 5 years. Which would be way above $2900 without stocks splits.
I m a bit conservative and I think we can go somewhere between 3 - 4 standard deviations.
Wishing you continued success on your trading journey. May this educational post inspire you to become an even better trader!
“Adapt what is useful, reject what is useless, and add what is specifically your own.”
David Perk ⚔
TSLAD trade ideas

Pull-back Post Austin LaunchNot quite a dark cover cloud candlestick today but given how strong the Nasdaq was today and NASDAQ:TSLA slumped is a fairly pathetic price action on day 2 post Austin launch.
IMO a lot of shorts were on the sidelines until robotaxi commenced. They waited for the pop and now feel more confident in entering short since they were able to assess launch. Buy the rumor sell the news if you will...
Correcting below the pre-launch price back to the lower wedge trend line around low 300s is my target.

The price will drop to at least $230The price will drop to at least $230. after that can goes to $200. but i have to re-check at $230
If you are thinking of investing, this is not a good place to buy at all.
I recommend entering in the $200 range after getting the necessary confirmations.
If you would like to follow me to see the rest of my analysis.

Tesla: Back on Track?Tesla has resumed downward momentum, aligning with our primary scenario and moving away from resistance at $373.04. As part of the ongoing turquoise wave 5, we expect continued selling pressure: it should break below the $215.01 support. This would complete magenta wave (3) of the current bearish impulse. A reversal back above $373.04 – and especially a breach of $405.54 – would force us to adopt the 38% likely alternative scenario. Under this count, the correction low of blue wave alt.(II) would be already in, and Tesla would now be rallying in wave alt.(III) .
📈 Over 190 precise analyses, clear entry points, and defined Target Zones - that's what we do.

TESLA Lagging BehindA compelling reason to buy Tesla stock now—despite it being beaten down—is the asymmetric risk-reward setup driven by its depressed valuation relative to long-term growth potential. Sentiment is currently low due to concerns about EV demand, competition, and Elon’s distractions, but this pessimism is largely priced in. Meanwhile, Tesla still holds massive optionality: AI-driven autonomy, energy storage, and Dojo supercomputing. If even one of these verticals scales meaningfully, current prices may prove a generational entry.
At the moment, we are hitting some of my key support levels being the anchored vwap from the low , as well as the previous Value Area High range retest within the formation of this broader triangle, suggesting a potential continuation to the upside should we get a strong breakout.
I will be watching for further down side as the current risk is only approx 6-7% for a potential upside of 60%-70% , a massive Risk to reward.
Should this reclaim the downtrend vwap, it can be a strong sign of strength for this stock to move back to ATH's as tesla is massively lagging behind.

One more drop. Another dip incoming — I just hope we don’t establish below around 260, that would turn bearish.
If we drop down to 260, I’ll be looking to buy again.

Short setup TiqGPT MARKET NARRATIVE:
Analyzing the Tesla Inc. charts across multiple timeframes, we observe a consistent downtrend from the daily (1D) to the 1-minute (1m) timeframe. The price action shows a series of lower highs and lower lows, indicative of a bearish market structure. The 1D chart reveals a significant bearish momentum with recent candles closing near their lows, suggesting strong selling pressure. This trend is echoed in the 4-hour (4h) and 1-hour (1h) charts, where price has failed to reclaim higher levels, instead forming bearish continuation patterns.
The 15-minute (15m), 5-minute (5m), and 1-minute (1m) charts provide a more granular view of the selling pressure, with price consistently making new lows. The absence of significant bullish retracements across these lower timeframes indicates that liquidity is being taken rather than created, as sellers push the price downward without substantial opposition.
INSTITUTIONAL THESIS:
Institutions appear to be in a distribution phase, offloading shares which is evident from the sustained downward movement and lack of significant pullbacks. This suggests a continuation of the bearish trend with potential further downside.
LEARNING POINT:
The consistent lower highs and lower lows across all timeframes highlight a strong bearish momentum engineered by institutional selling pressure.
SIGNAL: WAIT
SYMBOL: TSLA
ENTRY PRICE: $317.60
STOP LOSS: $322.00
TARGET PRICE: $310.00
CONDITION: Sell on a slight pullback to $317.60, which aligns with recent minor resistance levels on lower timeframes.
RATIONALE: Calculated risk/reward ratio of 1:1.7 (Risk=$4.40, Reward=$7.60) does not meet minimum 2:1 requirement. Waiting for better institutional setup with improved risk parameters.
Momentum & Exhaustion: No signs of exhaustion in selling, with candles closing near lows.
Liquidity Behavior: Continued push lower without significant retracements suggests ongoing institutional distribution.
Pressure Analysis: Strong selling pressure evident from the lack of bullish counter-moves.
Context Awareness: Price is trending down with no significant areas of demand observed that could halt the bearish momentum.
STRATEGIES USED:
Multi-Timeframe Bearish Continuation
Distribution Phase Trading
URGENCY: HIGH
TIMEFRAME: Short-term
CONFIDENCE SCORE: 85%
RISK/REWARD RATIO: Risk=$4.40, Reward=$7.60, Ratio=1:1.7 (Below 2:1 minimum)
Risk = $322.00 - $317.60 = $4.40
Reward = $317.60 - $310.00 = $7.60
Ratio = $7.60 / $4.40 = 1.72
RECOMMENDATION:
The calculated risk/reward ratio of 1:1.72 does not meet the minimum requirement of 2:1. Therefore, the recommendation is to WAIT for a better risk/reward setup or further confirmation of institutional activity that could provide a more favorable entry point.

Tesla LongCurrently hanging around at the Golden pocket of the uptrend.
Would be interested in a long if we got a retrace to the whole move golden pocket, which sits on the current range VAL. Would also sweep liquidity from the recent lows.
Would need to see a good reaction to take the trade.
6/25/25 - $tsla - Buying all dips going fwd6/25/25 :: VROCKSTAR :: NASDAQ:TSLA
Buying all dips going fwd
- "successful robotaxi or not successful robotaxi"
- elon's clearly won the vision game
- scaling hardware (cars, infra, optimus, solar) is m-o-a-t
- so is a humanoid and robotaxi robotics company that doesn't burn cash worth a trilly in today's world if the upside is perhaps 5-10 tn in the coming decade (worst case) and your downside here is what? 30... 40... 50%? Is it more? unlikely.
- so "yes" we remain entering consumer recessy. yes "tsla" shares r not cheap. and that's for a reason.
- buy scarce paper.
- buying all dips here.
- i like the dec '27 deep ITM leaps. allows me to wrangle size with a bit more flexibility in the coming months.
- but this rocketship has yet to make any meaningful moves.
- $1,000/shr is the 2Y tgt.
V
TSLA : Technical Analysis Report - 30 June 2025Trend:
The primary trend (big picture) is upward. Bullish momentum is weak.
Short Term Trend : sideways / consolidation. Regardless of the larger trend, momentum within a sideways range is typically neutral or flat, reflecting a temporary balance between buyers and sellers.
Pattern : Symmetrical Triangle Patte rn
A symmetrical triangle is like a market catching its breath. It's a temporary pause in a trend. Once the price breaks out of the triangle, it usually continues in the same direction it was going before. Until that breakout, it's a neutral pattern.
Key levels :
R2 - 366
R1 - 356
S1 - 315 -The price is facing the support 215.
S2 - 275
Tips for Trading
Wait for a confirmed breakout (e.g., a daily candlestick close above/below the trendline) to avoid false signals
-----------------------
Note :
If you’re interested in receiving detailed technical analysis reports on your selected stocks, feel free to reach out to me. I can provide you with customized reports covering trends, key levels, momentum, patterns, and price projections to support your investment decisions.

TESLA falling down to 250 USD?Tesla is consolidating in a tight range, showing bearish pressure near the lower boundary of the formation. Moving averages (MA 5/10/30/60) are flattening, indicating a loss of bullish momentum, while the Wavetrend oscillator has issued a sell signal (bearish crossover below the zero line). A downside breakout from this range projects a potential move toward the $250 level, as illustrated by the measured move. This bearish scenario gains validity if price breaks below the $315 support level.
Possible TP: 250 USD

Tesla-Heading For A New ATH?NASDAQ:TSLA is looking good!
Robo-Taxi, Optimus Robots...and so more to come!
Tesla to $692 in the next years? Or months?
#stocks #tesla #stockmarket

Long-Term Growth Potential in the Face of Short-Term ChallengesCurrent Price: $323.63
Direction: LONG
Targets:
- T1 = $331.50
- T2 = $345.00
Stop Levels:
- S1 = $319.50
- S2 = $310.00
**Wisdom of Professional Traders:**
This analysis synthesizes insights from thousands of professional traders and market experts, leveraging collective intelligence to pinpoint high-probability trade setups. The wisdom of crowds principle suggests that aggregated perspectives from experienced professionals build a more balanced outlook on Tesla, reducing emotional biases and highlighting consensus opportunities in the market.
**Key Insights:**
Tesla is currently navigating through a challenging phase characterized by competitive pressures in both China and Europe. Recent macroeconomic headwinds, including rising interest rates and shrinking global spending on electric vehicles, have fueled concerns about short-term sales performance. However, analysts remain optimistic about Tesla's innovation leadership, particularly in AI-driven robotics, battery technology, and autonomous mobility development. The recent technical charts reflect a narrowing wedge formation, and a breakout above $354.78 could confirm renewed bullish momentum, offering significant upside potential.
**Recent Performance:**
Over the past few weeks, Tesla has experienced tight price consolidation, underlying near-term indecision among market participants. While its stock price remains below short-term moving averages, signaling bearish pressure, longer-term sentiment is bolstered by overall optimism in the technology sector. Additionally, fluctuations in deliveries and revenue from various regions continue to impact day-to-day trading sentiment, with the stock showcasing higher volatility during earnings updates.
**Expert Analysis:**
Market analysts exhibit cautious optimism surrounding Tesla. Short-term concerns linger about declining sales growth in legacy markets such as Europe and the loss of its dominant position in China due to rising competition from local manufacturers like BYD. However, whether Tesla can monetize its cutting-edge developments in AI, robotics, and autonomous driving remains a focal point of its long-term strategy. Analysts agree that while these initiatives may redefine the EV market over the next 5-10 years, revenue realization is expected to be slow and could dampen speculative enthusiasm in the immediate term.
**News Impact:**
Tesla recently announced the launch of its robo-taxi initiative, beginning trials in Austin, Texas, a move that challenges traditional mobility norms. While this innovation enhances Tesla's narrative as a disruptor in the industry, regulatory obstacles and scalability issues pose immediate hurdles that could delay market adoption. On the downside, Tesla saw declining deliveries in Europe and China, casting shadows over its near-term growth prospects in these critical regions. Investors should keep a close eye on upcoming earnings reports for clearer guidance on production schedules and delivery forecasts.
**Trading Recommendation:**
Based on recent technical consolidation and consensus expert views, traders are recommended to take a long position on Tesla with price targets of $331.50 and $345.00. The stock exhibits signs of medium-term upside potential if momentum aligns with broader bullish trends in the S&P 500 and technology sectors. Implement disciplined risk management with stop levels set at $319.50 and $310.00 to protect against unfavorable moves. Investing in Tesla provides exposure to a high-risk innovation-driven narrative; traders should evaluate their appetite for risk carefully before entering this position.

TLSA Catalyst Ranking and Market Update: June 2025Here's an updated/revised outlook for TSLA including all the primary
catalyst ranking and analyst ratings and overview of latest developments
🔋 1. EV Demand Growth
Strength: 9/10 → 9/10
Global electric vehicle adoption remains the dominant pillar. Tesla faces softer comp in Europe (–40.5% drop in May) wsj.com, but overall trend remains firmly upward. 🌍
🚗 2. Affordable Entry Level Model
Strength: 8.5/10 → 8.5/10
Tesla still on track to launch a < $25K EV in first half of 2025. Any delays or execution issues could pressure sentiment.
⚡ 3. Battery Cost & Margin Improvement
Strength: 8/10 → 8/10
Margins saw slight relief Q1, driven by cost cuts f, but macro headwinds persist.
🤖 4. Autonomy & Robotaxi Rollout
Strength: 7.5/10 → 8.5/10
Robotaxi debuted in Austin in June, sparking a ~10% one-day stock surge. Benchmark raised its target to $475/buy on the rollout—strong tailwind.
🚩 5. Competition
Strength: 7/10 → 6.5/10
Rivals like Xiaomi’s new YU7 are gaining ground. Tesla must maintain differentiation.
📉 6. Trade Policies & Tariffs
Strength: 6.5/10 → 6.5/10
Still relevant due to Tesla’s global footprint, though less front-page than before.
💰 7. Incentives & Subsidies
Strength: 6/10 → 6/10
U.S. IRA tax credit policies remain supportive; evolving eligibility remains a swing factor.
🛢️ 8. Commodity Costs
Strength: 5.5/10 → 5.5/10
Raw-material swings affect margins. Inventory hedges help but not wholly mitigate.
📈 9. Fed & Interest Rates
Strength: 5/10 → 5/10
A higher-rate environment still limits valuation multiples for growth-tier companies.
🎭 10. Musk Profile & Governance
Strength: 4/10 → 5/10
Analysts (e.g., Bradley Tusk) warn of being “massively overvalued” tied to Musk’s persona. Musk’s renewed focus on Tesla vs. other ventures (DOGE, SpaceX) will be watched.
________________________________________
🚀 Refreshed Catalyst Rankings
Rank Driver Score
1 EV demand growth 9
2 Affordable model 8.5
3 Battery costs/margins 8
4 Autonomy/robotaxi execution 8.5
5 Competition 6.5
6 Trade & tariffs 6.5
7 Regulatory incentives 6
8 Commodities 5.5
9 Fed Rates 5
10 Musk reputation/governance 5
________________________________________
📊 Latest Analyst Ratings & Targets
• Benchmark / Mickey Legg: Buy, target $475 (from $350) — cites robotaxi safety-first rollout, automation upside
• Wedbush / Dan Ives: Outperform, target $500 — labels TSLA as an “embodied AI compounder”
• Morgan Stanley / Adam Jonas: Buy, target $410 — bullish on AI/self driving positioning
• Cantor Fitzgerald / Andres Sheppard: Overweight, target $355 — optimism rooted in robotaxi and FSD rollout
• UBS / multiple: Sell, target $215–225 — skeptical on demand and valuations
Consensus snapshot (FactSet):
• Mean price target ≈ $311–$312
• Mean rating between Hold–Buy (~2.7/5)
________________________________________
🗞️ Recent Headlines
• “Tesla completes first fully autonomous Model Y delivery ahead of schedule”
• “Tesla robotaxis launch in Austin” boosting momentum
• “EU Tesla sales slump” May registrations down 40.5%
• “Tesla fires longtime insider as Europe slump deepens”
________________________________________
🔍 Summary Outlook
Tesla shares are navigating a volatile interplay of strong tech promise and unfolding execution risks:
• Overweight view (Legg, Ives): Robotaxi rollout and AI thrust fuel upside. Automation transition seen as transformative.
• Bullish base (Jonas, Sheppard): AI, FSD rollout, affordable model support core thesis.
• Skeptical view (UBS, Tusk): Slumping deliveries in Europe/China, heavy valuation, Musk's external focus seen as emotional dampener.
Upcoming triggers to watch:
1. Q2 delivery and production results (mid July).
2. Robotaxi rollout execution/regulatory clearance.
3. Margin trajectory as costs evolve.
4. FSD reliability and expansion in new markets.
________________________________________
✅ What This Means for You
• Bull case: Robotaxi + AI momentum may drive TSLA back toward targets in the $475–500 range.
• Bear case: Weak deliveries, macro and competition pressures could cap shares or trigger pullback toward prior support ($330–350).
• Neutral: Watch near-term delivery and autonomy news to shape next move.

TSLA Bearish Breakdown in Progress – $322 or Bust? TSLA Bearish Breakdown in Progress – $322 or Bust? Monday Puts On Watch 🔻
🧠 GEX-Based Options Sentiment:
Tesla is currently trading right at a critical GEX flip zone. The $330 level used to be gamma support but has now broken, leaving TSLA vulnerable to a drop toward the high-risk gamma pocket between $320–$310.
The Highest positive GEX zone was stacked near $330–$340, but that structure has failed. The gamma walls above—like $347.5 and $350—now serve as resistance, especially with no strong call flow to support a squeeze.
The downside gamma structure is open. $310 is a soft magnet, but $300 is where the largest negative GEX sits, along with the 2nd and 3rd Put Walls. If TSLA continues slipping, a drop into the $300 zone could be swift.
Implied Volatility Rank is at 25.2, with IVX above 68 — meaning options are expensive, so spreads are safer than naked calls or puts. Flow is still 8% call-heavy, but that can flip hard if Monday starts red.
🔧 Options Trade Setup (for Monday–Wednesday):
Bearish Scenario (favored setup):
If TSLA opens weak or rejects $325–$327.50 area again, consider buying a PUT debit spread, such as 322p/310p or 320p/300p (July 3 expiry).
Target zone: $312, then $300 gamma flush.
Stop: reclaim of $331 with bullish momentum.
Bullish Scenario (lower probability):
If TSLA reclaims $330 and breaks trendline toward $335, consider a CALL debit spread like 335c/345c (Jul 3).
Target zone: $345–$350.
Cut if it falls back under $327.50.
📉 Intraday Technical Breakdown (1H Chart):
The price has confirmed a CHoCH + BOS combo, rejecting from supply and pushing below the rising trendline. Friday’s recovery attempt stalled right under that broken structure, and sellers took over late day.
The 1H chart is forming a bearish descending channel, with price currently trying to bounce off short-term demand, but failing to reclaim the key mid-zone.
This current setup favors continuation lower unless bulls can pull off a breakout early Monday. Otherwise, the path of least resistance is down.
📌 Key Levels to Watch:
$330.00 – Former GEX support, now resistance
$331.10 – Trendline and bearish trigger flip
$322.00 – Key support line (last defended Friday)
$320.00 – Gamma pivot zone
$310.00 – GEX magnet and low-volume shelf
$300.00 – Highest negative GEX and major PUT support zone
$345.25 – Upper trendline + prior supply rejection
✅ Thoughts and Monday Game Plan:
TSLA is sitting on the edge of a breakdown. The gamma structure supports further downside as long as price stays below $330. Watch for early rejection at $325–$327.50 to initiate puts.
If bulls manage to gap and reclaim above $331, reassess for a reversal setup — but for now, structure, volume, and GEX are all pointing down.
This is a reactive trade — wait for early confirmation on Monday and ride the wave, especially if SPY opens weak.
Disclaimer:
This analysis is for educational purposes only and not financial advice. Always trade with proper risk management and do your own due diligence.

TESLA CORRECTION ON THE WAY? + MY WATCHLIST FOR JULY 2025In this video, I run through a couple stocks that look very interesting going into Q3 2025, all stocks listed below!
NASDAQ:TSLA
NASDAQ:CELH
NYSE:EL
NYSE:NKE
NASDAQ:SOFI
AMEX:SPY
NASDAQ:QQQ
NASDAQ:AMD
NASDAQ:CAKE

super sell on the run for TSLAwe looking for sells on this pair as you can see there is a trend moving up but there is likly to have a short sells going on now

"Tesla: Accumulating Before Takeoff?"Tesla's acting weird, but to me, it looks like it's just loading up. Every time it hits that $320 zone, it bounces back hard. That’s not random — there’s volume, and it’s holding that level with respect.
If it breaks above $330 with solid volume, this thing could easily hit $356 or more. And with earnings coming up and all that robotaxi noise Elon keeps teasing… wouldn’t be surprised if it pops hard.
I’m not saying buy right now, but I’ve got my eyes on it. If I see confirmation, I’m jumping in with a long contract. Now, if it drops below $312 with conviction, I’m out — no hard feelings.
This could get real interesting. Stay sharp.
Safe Entry Zone TeslaGreen Zone is Safe Entry Zone.
Target is Take Profit line.
Note: 1- Potentional of Strong Buying Zone:
We have two scenarios must happen at The Mentioned Zone:
Scenarios One: strong buying volume with reversal Candle.
Scenarios Two: Fake Break-Out of The Buying Zone.
Both indicate buyers stepping in strongly. NEVER Join in unless one showed up.
2- How to Buy Stock:
On 15M TF when Marubozu Candle show up which indicate strong buyers stepping-in.
Buy on 0.5 Fibo Level of the Marubozu Candle, because price will always and always re-test the imbalance.

TSLA Long Trade Setup !📈 🚀
Price squeezing at triangle apex—breakout zone 📊
Entry: $327.38 ✅ | Stop: $322.18 🛑
Target: $344.14 🎯 — bullish pressure building! 🔼
#TSLA #LongTrade #TeslaStock #BreakoutSetup #TradingView #TechnicalAnalysis

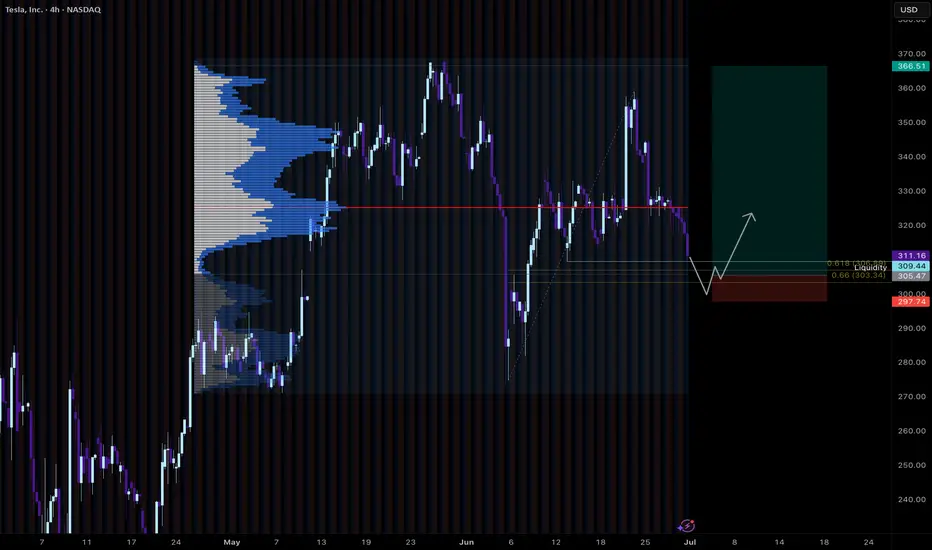
Tesla (TSLA) -Bullish Reaccumulation Setup | Smart Money conceptTesla shows a clean CHoCH followed by BOS structure, indicating a potential bullish continuation. The market is forming equal lows into a demand zone (green box), suggesting a possible liquidity sweep before a move higher.
Key Technical Points:
CHoCH (Change of Character) confirmed on strong bullish impulse.
BOS (Break of Structure) signals market intent to continue upward.
Ascending triangle structure with multiple support tests (marked "S").
Anticipated sweep into demand zone: $308–$312 area.
Potential upside target: $365–$375 supply zone.
Bias: Bullish on confirmation of demand reaction.
Disclaimer:
This is not financial advice. Always do your own analysis before investing.

Tesla (TSLA) 1H Chart – Wyckoff Cycle in ActionThis chart reflects a textbook Wyckoff pattern unfolding on TSLA’s 1-hour timeframe:
🔹 Accumulation Phase observed early May
🔹 Followed by Manipulation & Distribution – classic trap before markdown
🔹 Sharp selloff led to another Accumulation zone around $305
🔹 Further manipulation wicks indicate smart money involvement
🔹 Now projecting a move towards $360–$370 distribution zone
📌 Structure breakdown:
Smart Money Accumulation ➡️ Manipulation ➡️ Distribution
Bullish momentum building from $306 support
Eyes on reaction near the marked green distribution box 📦
📅 As of June 15, 2025 – chart aligns with Wyckoff theory and institutional behavior.

V-Bottom + Apocalypse news => Going UpV bottom was formed.
News are clearly bearish in a conclusive way =>> fool the public to sell shares to the big fish while the market will go up...
Overall market sentiment under the hood is bullish. Public is in huge fear of banks that collapsed and will continue to collapse, so the masses will sell stocks on an up wave fearing it will go down.
How else you will make the mass public sell their stocks? if there is no apocalypse on the way...? think about it...
