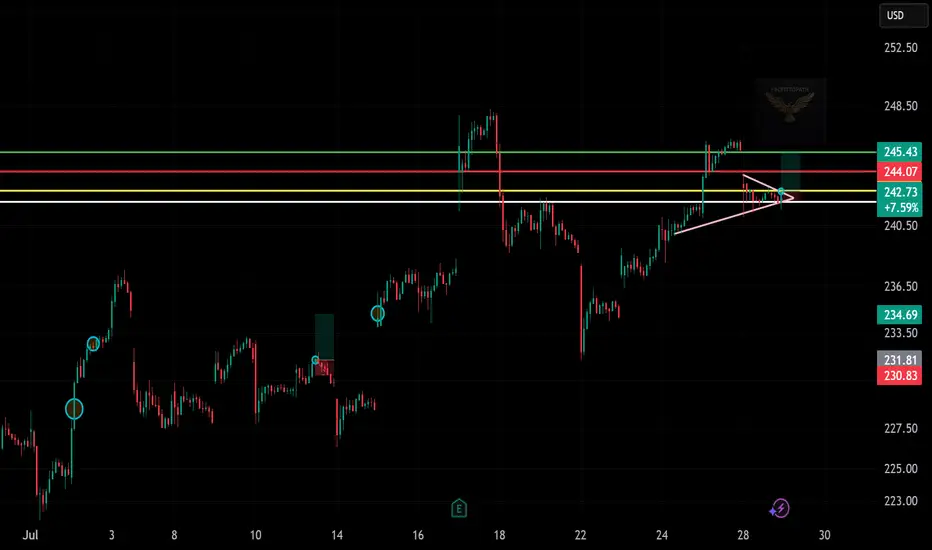
Trade Setup: LONG on TSM !📈 (Taiwan Semiconductor)
🕰️ Timeframe: 30-minute chart
🔍 Pattern: Ascending triangle breakout
📉 Previous Trend: Recovery after drop
🔁 Setup: Bullish continuation with breakout confirmation
🧩 Technical Breakdown:
Support Zone:
~$242.50 (yellow horizontal support)
Uptrend line holding as dynamic su
32.45 B USD
80.04 B USD
About TAIWAN SEMICONDUCTOR MANUFACTURING
Sector
Industry
CEO
Che Chia Wei
Website
Headquarters
Hsinchu
Founded
1987
ISIN
ARDEUT113016
FIGI
BBG000PXD6R2
Taiwan Semiconductor Manufacturing Co., Ltd. engages in the manufacture and sale of integrated circuits and wafer semiconductor devices. Its chips are used in personal computers and peripheral products, information applications, wired and wireless communications systems products, and automotive and industrial equipment including consumer electronics such as digital video compact disc player, digital television, game consoles, and digital cameras. The company was founded by Chung Mou Chang on February 21, 1987 and is headquartered in Hsinchu, Taiwan.
Related stocks
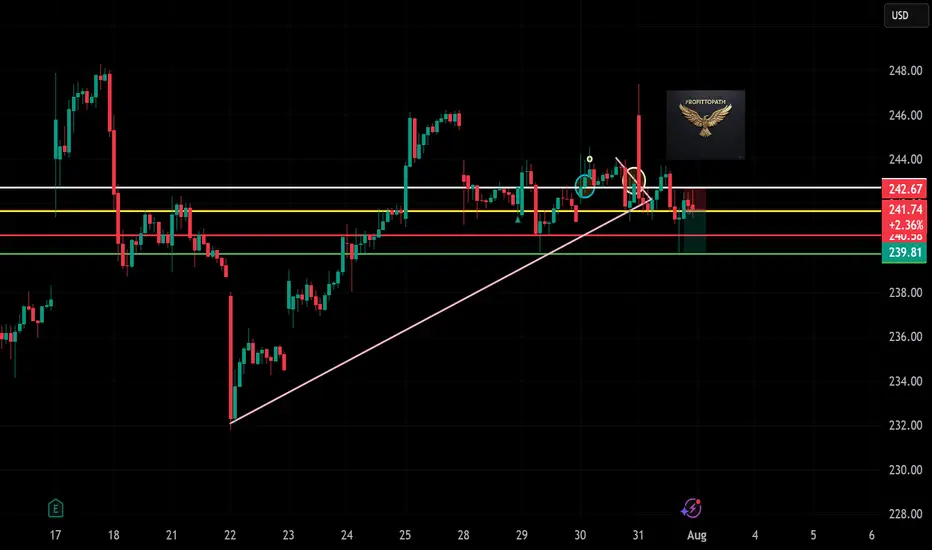
TSM Breakdown — Short Trade in Motion!“”
🎯 Setup:
→ Entry: ~$241.74
→ SL: ~$243.00
→ Target: $239.81
📌 Bearish rejection + trendline break = short opportunity.
TSM eyes on $194: Major Resistance to Break-n-Run or Dip-to-Buy TSM has been recovering with the chip sector.
Currently testing a Major Resistance zone.
Look for a Dip-to-Buy or Break-n-Retest entry.
$193.92-195.18 is the exact zone of concern.
$177.83-178.31 is the first major support.
$203.68-204.56 is the first resistance above.
============================

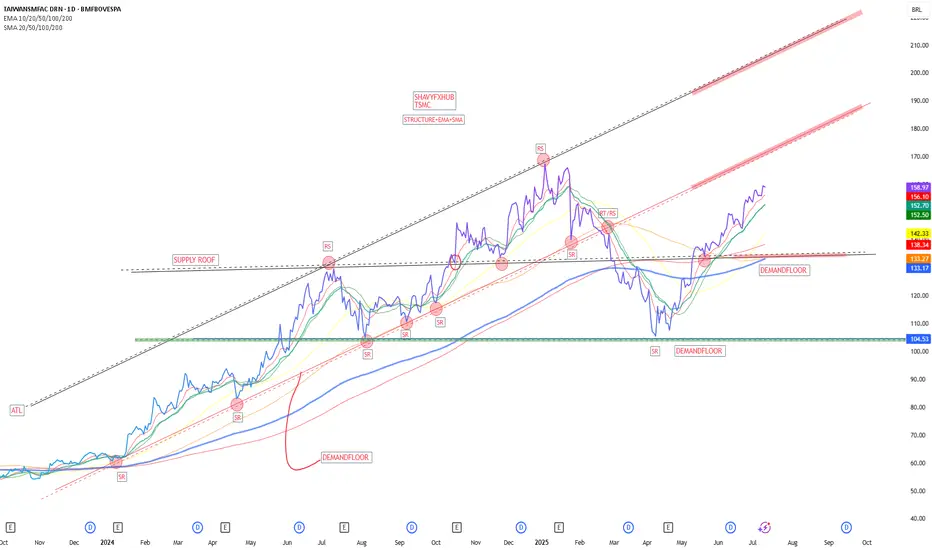
TSMCThe Taiwan Semiconductor Manufacturing Company Limited (TSMC) is the world’s largest and most advanced semiconductor foundry, headquartered in Hsinchu Science Park, Taiwan. Founded in 1987 by Morris Chang, TSMC pioneered the pure-play foundry model, focusing exclusively on manufacturing chips design
TsmEdged up to the top of resistance here.
Expecting a correction back to 176-185 area here
1hour chart
Here's the uptrend since april..
The support would now be around 227.
I expect a pullback to that area this week and if support holds price could bounce back and tag weekly resistance arou

Higher Prices Inbound!NYSE:TSM , market dominance, serving clients such as NASDAQ:AAPL , NASDAQ:NVDA and NASDAQ:AMD . AI demand surging, strong financials with optimistic revenue outlook.
At a RS Rating of 90
I have reasons to believe this equity price could increase

TSM (Taiwan Semiconductor)-Breakout Play with Strong FundamentaTicker: TSM (NYSE)
Recommendation: BUY
Current Price: $216.62
Entry Zone: $216 - $218 (Breakout confirmation)
Stop Loss: $190 (Key support level, -12.3% from entry)
Take Profit: $270.04 (+24.7% upside)
Risk/Reward Ratio: 1:2
📈 Technical Analysis
Trend: Strong bullish momentum across all timeframes

TSM - Bullish Trade IdeaENTRY ZONE & STRIKE ANALYSIS
Optimal Entry Range: $209.80–$210.60 (Pullback Zone into Arc FVG base)
Momentum Entry: Above $214.35 with 15m/30m breakout + bull volume
Strike Focus: TSM 215c / 220c
Expiration Range: June 28 → July 5 (prefer IV pop from short consolidation breakout)
🛡 SL/TP LADDER

TSM Weekly Options Setup – Overbought with Max Pain Pressure (20📉 TSM Weekly Options Setup – Overbought with Max Pain Pressure (2025-06-11)
Ticker: NYSE:TSM (Taiwan Semiconductor)
Bias: 🔻 Moderately Bearish (Short-Term)
Setup Type: Max Pain Reversion Play | Confidence: 65%
Expiry: June 13, 2025 | Entry Timing: Market Open
🔍 Technical & Sentiment Snapshot
📍 Pr

$TSM Setup – A.I. Backed Bullish SignalTaiwan Semi ( NYSE:TSM ) shows breakout potential with AI tailwinds and sector strength. Predicted range: $197.55–$205.45. Model Grade: A. Trend: +1.38%.

See all ideas
Displays a symbol's price movements over previous years to identify recurring trends.
TSM5285159
TSMC Arizona Corp. 3.25% 25-OCT-2051Yield to maturity
5.78%
Maturity date
Oct 25, 2051
TSM5285158
TSMC Arizona Corp. 3.125% 25-OCT-2041Yield to maturity
5.60%
Maturity date
Oct 25, 2041
TSM5399900
TSMC Arizona Corp. 4.5% 22-APR-2052Yield to maturity
5.27%
Maturity date
Apr 22, 2052
TSM5050794
TSMC Global Ltd. 1.375% 28-SEP-2030Yield to maturity
4.68%
Maturity date
Sep 28, 2030
TSM5170546
TSMC Global Ltd. 2.25% 23-APR-2031Yield to maturity
4.62%
Maturity date
Apr 23, 2031
TSM5170544
TSMC Global Ltd. 1.75% 23-APR-2028Yield to maturity
4.55%
Maturity date
Apr 23, 2028
TSM5285157
TSMC Arizona Corp. 2.5% 25-OCT-2031Yield to maturity
4.48%
Maturity date
Oct 25, 2031
TSM5399899
TSMC Arizona Corp. 4.25% 22-APR-2032Yield to maturity
4.47%
Maturity date
Apr 22, 2032
TSM5448853
TSMC Global Ltd. 4.625% 22-JUL-2032Yield to maturity
4.38%
Maturity date
Jul 22, 2032
TSM5399898
TSMC Arizona Corp. 4.125% 22-APR-2029Yield to maturity
4.34%
Maturity date
Apr 22, 2029
TSM5285156
TSMC Arizona Corp. 1.75% 25-OCT-2026Yield to maturity
4.34%
Maturity date
Oct 25, 2026
See all TSMC bonds


