UNH UnitedHealth Group Incorporated Options Ahead of EarningsIf you haven`t sold UNH`s Double Top here:
or reentered the Double Bottom:
Then analyzing the options chain and the chart patterns of UNH UnitedHealth Group Incorporated prior to the earnings report this week,
I would consider purchasing the 530usd strike price Calls with
an expiration date of 2023-10-13,
for a premium of approximately $6.40.
If these options prove to be profitable prior to the earnings release, I would sell at least half of them.
Looking forward to read your opinion about it.
UNH trade ideas

UNH : Swing inside within the band and now BreakoutSwing Scalping Period : 14 April - 1 Sep 2023
- The share price swing up and down within the band, scalp the profit by selling 50% at the middle line and the rest breakeven or opposite side band
Trending up period : 1 Sep - 13 oct 2023
- Entry when price enter and closed inside the band of midas on 1sep, trend midas line turn to pink on 19sep, this is a typical jackpot type of entry.
(it will not happen each n every time, be RATIONAL.)
Let the profit run : 19 sep - 13 oct 2023
- we will not have full long position on this period, as a scalper/trend trader, we will already bagged some profits and enjoy the ride until the middle trend midas color change to white.
* A sharing on how to use band of midas as reference.
* None of the indicator works perfectly.
* Be honest and rational.

UNH SELL ++++UNH is overbought here and should retrace to $518 and as low as $509 before possibly continuing higher. Major overhead resistance at $548 range.

watching for pivot level break 💥UNH recent bounce from bullish trend support, if it can break 495 pivot level then quick push to 507-528 is likely
make or break once we get to 1st target though, strong trend resistance around that level 👀

UNH's Prescription for Success: Exploring the Surge in UNH StockUNH NYSE Stock: Riding High on a Bullish Run
UnitedHealth Group's (UNH) stock on the NYSE is experiencing a remarkable bullish run today. The surge can be attributed to the company's impressive financial performance and its role in the healthcare sector's evolution. UNH's robust earnings, expanding healthcare services, and strategic acquisitions have garnered investor confidence. The growing demand for healthcare services, amplified by pandemic-driven awareness, fuels UNH's ascent. Technical indicators, including Relative Strength Index (RSI) and Moving Averages, confirm the bullish sentiment. As healthcare remains a critical focus globally, UNH is well-positioned to continue its bullish stride, making it a standout in today's market.

Earnings Journal█ SIMPLISTIC ANALYSIS </
Current Market Trend: long/buyers/positive.
Next Wave: buy wave to a new ceiling.
Next Swing: negative swing to support.
Trade Type: Touch & Go don't wait for a close.
█ EARNINGS AT A GLANCE </
Release Date: 10/13 BMO
Earnings Anticipations: positive surprise for EPS & Revenues.
Surprise-Confidence on a scale of 0-5: #4
EPS & Revenue 2-Year Trend: the trend in EPS is positive, the trend in Revenues is positive.
█ SYNOPSIS </
"I expect the market will buy the surprise if the earnings report hits the Wall Street consensus, or sell the surprise if the earnings report misses the Wall Street consensus."
█ BACKGROUND </
Research Depth: technical & fundamental glance only.

Unitedhealth Group broke above the Diamond rocket to $579Broadening Diamond shape has formed since 5 January.
It was an either or situation. Either it breaks up or down. Clearly, it's broken up giving a decent Risk to Reward ratio.
Now the momentum will most likely push the price up.
7>21>200
RSI>50
Target $579

UNITED HEALTH Mega bullish break-out. ATH next.United Health Group Incorporated (UNH) broke above the Lower Highs trend-line that has been holding since the October 31 2022 All Time High (ATH). That is a major bullish break-out signal alone but has one last short-term Resistance to overcome, Resistance 1 (516.00) which happens to be exactly on the 0.618 Fibonacci retracement level.
If that Resistance level breaks, we will buy and target Resistance 2 (530.65). Then even though the bullish leg might extend higher, we will only buy after a clear pull-back to the 0.618 Fibonacci and target the ATH (558.00) that happens to be just above Resistance 3.
The Lower Highs bullish break-out signal is strengthened by the fact that the RSI on the 1W time-frame is coming off a Bullish Divergence. On such long tern downtrends, this typically signifies a strong bullish reversal.
-------------------------------------------------------------------------------
** Please LIKE 👍, FOLLOW ✅, SHARE 🙌 and COMMENT ✍ if you enjoy this idea! Also share your ideas and charts in the comments section below! **
-------------------------------------------------------------------------------
💸💸💸💸💸💸
👇 👇 👇 👇 👇 👇

UNH Stock Short Planning to sell UNH at 512.50 with a stop loss above 530 as there is a lot of resistance at that level and it will be a very good level to sell with a pattern on H4 and M15 will be overbought by then with a double top present. We are planning to sell this based on the divergence present and this being the third top.

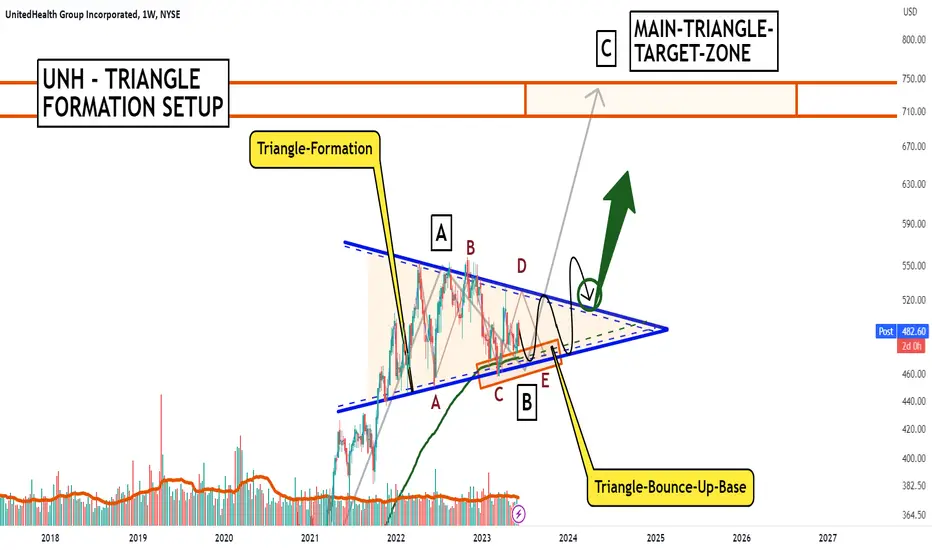
UNH, Paramount Triangle-Formation, Breakout-Sights!Hello There!
Welcome to my new analysis about UNITED HEALTH GROUP - UNH on the weekly timeframe perspective. Although many stock market indices these day´s show a more bearish inclination there are also interesting gems within the market showing more bullish inclinations and setups to consider such as with UNH. The stock is quite established within the healthcare market and health insurance market being one of the top 20 stocks listed by market-cap giving a fundamental base for volume to hold steady or increase for the pair. Considering the technicals UNH is right now trading within this main steady uptrend in which it is still remaining without a bigger pullback. The interesting part now is that UNH is forming this delicate triangle formation right above the 100-EMA with the 100-EMA playing a major role as the support driver within this whole uptrend and the triangle forming above the 100-EMA. Now, once UNH has moved on to complete the wave-count within the triangle this will be the great setup for a final breakout and completion of the triangle to target the upper target-zones as seen in my chart. Once the breakout happened with the right confirmation as shown there is a high likelihood for the targets to be reached with high momentum as well.
Thank you everybody for watching. It will be great when you support my idea and we move on forward together.
"Faith is a passionate intuition."
VP
UNH long positionHi traders! Let's have a look to UNH stock.
It has been in a down trend for a while. We expect that the price meet up the horizontal support and then get a bounce to the downsloping resistance.
Our entry point is at the horisontal support and the target is at the downsloping resistance. Stoploss you can see on the chart.
Good luck!

UNH, Holding The Established Level, Possibility To Continue!Hello Traders Investors And Community, welcome to this analysis where we are looking at the selected single stock value UNH (UNITED HEALTHGROUP INC) the recent events within it, the current interesting price-formation and what the stock can provide in order for possible upcoming trading opportunities. As I pointed out already in previous analysis there are stocks which can move anticyclical to the main market as the demand is increasing due to the corona-crisis, one sector in this possible anticyclical market movers is the health sector where UNH is building an important part within health insurance as more and more people looking for improved healthier life and want to be secure in this case, therefore, this fact can play a big factor in the development of bullishness within this stock, besides that there are also some meaningful technical signals making an upcoming bullish continuation possible within this stock.
As you can examine when looking at my chart UNH is moving in this recently established uptrend channel where it bounced at strong support at the POINT OF CONTROL you can watch marked in red, this is the point where the stock showed the most volume overall, therefore, an important support/resistance level which confirmed as support in this case. Furthermore, we have this newly established all-time-high at 305.5 which has taken out the all-time-high formed before the corona-breakdowns seen this year, firstly this can also be a bull-trap but as the price is holding near that level this is showing up some significant bullishness in that level and a sign that the breakout could not have been a bull-trap. As the stock currently tests this level with some healthy volatile up moves this can be an indication for a possible continuation to the upside when UNH manages to climb above these levels as you can see it marked in my chart.
As you can watch in my chart there are some solid support levels providing an increasing possibility for the bullish case, once it is the 100-EMA which is marked in black, secondly, it is the POINT OF CONTROL which is building up very strong support in this level and next to the overall uptrend channel building altogether a coherent bullish support cluster here where the price will have a hard time going below when there comes bearish pressure into the surface. These factors making a bullish continuation to the upside more possible which will be confirmed when UNH takes out the current resistance it is testing and forms some faster-moving trend which finally breaks above the uptrend channel to confirm more bullishness in this case, remember that this has to be confirmed properly and before it does not happen there is still a possibility to show bearish which is quite marginal but it should not be ignored in either case.
Overall this stock is showing some serious bullish signals for a possible continuation to the upside making the movement at the all-time-high-conditions in this stock a stronger one than rest of the market where many stocks and some indices are still below the all-time-high established before the corona-breakdowns and therefore there is no confirmation of the bull-market-ending till now, therefore, it is important to look for stocks which showing up stronger than rest market when considering something on the long-side which I showed with other stocks of other sectors in the previous analysis were some holding strong bullish above the EMA structure and other below it with incoming bearish signs, in this case, it is important to not averagely evaluate the whole market in just one direction which can be fatal in such market phases showing up these days as there are stocks profiting of the crisis while another struggle to hold the status quo.
In this manner, thank you for watching, support for more market insight, have a great day, and all the best to you!
There are many roads to prosperity, but one must be taken.
Information provided is only educational and should not be used to take action in the markets.

UNH: Complex Bearish Head & Shoulders /Hidden Bearish DivergenceUnitedHealth Group has formed this Complex Head and Shoulders pattern on the weekly time frame and has formed two layers of MACD Hidden Bearish Divergence. The most recent action we got on this stock was a weekly bearish engulfing candle, and now we're expected to see it come down at least to about $300, which would be very bad for the Dow Jones Industrial Average as UNH is the top weighted holding of the index.

UNH on watch for continuation after pullback LONGUNH after earnings with a mild beat in mid July, price shot up for one week then went
sideways and then pulled back in the past week. Price is now at 497 and under
the dynamic resistance of the first deviation line above the mean VWAP. The dual
time frame shows a good pattern with the shorter TF of 3 minutes in green above the
longer TF of 45 minutes in black. The short TF is above the 50 level.
Overall, I think the pullback is about over. I will take a long trade with a buy stop of
500.25 setting the stop loss below what will become dynamic support of the blue
line at 499.5. This is a tight stop and low risk owing to the positioning of the trade
about a support level. I will target 515.00 for a risk to reward ratio of 0.75 to 15
or 1:20 which is outstanding. I may take a call option striking $510 out a couple of months
if it would not draw down by the cash portion of my overall portfolio more than 3%. This
option premium is about $9000 but I think the potential profit is about the same.

UNH can break $600 provided it maintains >20x PE multiple. At $511, UNH shares trade at 21.72x TTM Earnings Per Share of $23.53 for the twelve months ending in June 2023.
The company is expected to report $24.87 in EPS for the current fiscal year, $27.94 in the next fiscal year, and $31.37 in the year after.
The 200D EMA PE Ratio for UNH was 23.20x.
Placing a 21.7x and 23.2x multiple implies a 6% and 13% rally by the end of the current fiscal year. Placing a 21.7x and 23.2x multiple for the subsequent fiscal year's EPS of $27.94 implies a rally of 19% and 27%. Placing a 21.7x and 23.2x multiple for the $31.37, the company is expected to earn in two fiscal years implies shares can rally 33% and 43%, respectively.

#UNH Trading The Bull Flag BreakoutIn this update we review the recent price action in United Health shares and identify the next high probability trading opportunity and price objectives to target

UNHLong Term, Momentum Factor Opportunity. There is potential for a further share price advance following the company recently exceeding Wall Street's estimates on a both a revenue and earnings per share basis as well as raising guidance. The strong results also raises the potential for analyst ratings revisions. From a technical standpoint, the share price rallied sharply, suggesting a positive reception from the market. Subsequently, the share has held it's range highs, consolidating from 19 July to present. While a minor retracement always remains possible, the tight consolidation below the medium term downward trend line has a high probability of being breached. This would open the potential for a test of a prior swing highs above $550. Time Stop: 01 March 2024

United Health Group in a bull flag.United Health Group - 30d expiry - We look to Buy a break of 516.11 (stop at 506.11)
Daily signals are bullish.
There is no clear indication that the upward move is coming to an end.
Price action is forming a bullish flag which has a bias to break to the upside.
A break of the recent high at 516 should result in a further move higher.
This stock has seen good sales growth.
Our profit targets will be 541.11 and 546.11
Resistance: 511 / 516 / 520
Support: 503 / 497 / 490
Please be advised that the information presented on TradingView is provided to Vantage (‘Vantage Global Limited’, ‘we’) by a third-party provider (‘Everest Fortune Group’). Please be reminded that you are solely responsible for the trading decisions on your account. There is a very high degree of risk involved in trading. Any information and/or content is intended entirely for research, educational and informational purposes only and does not constitute investment or consultation advice or investment strategy. The information is not tailored to the investment needs of any specific person and therefore does not involve a consideration of any of the investment objectives, financial situation or needs of any viewer that may receive it. Kindly also note that past performance is not a reliable indicator of future results. Actual results may differ materially from those anticipated in forward-looking or past performance statements. We assume no liability as to the accuracy or completeness of any of the information and/or content provided herein and the Company cannot be held responsible for any omission, mistake nor for any loss or damage including without limitation to any loss of profit which may arise from reliance on any information supplied by Everest Fortune Group

$UNH with a bullish outlook following its earnings #StocksThe PEAD projected a bullish outlook for NYSE:UNH after a positive under reaction following its earnings release placing the stock in drift A with an expected accuracy of 75%.

Falling WedgeEarnings beat.
Opposite of a rising wedge as both trendlines slope down and narrow at the apex.
Price is at the resistance line of the structure.
No recommendation

UNH earningsUnited health Group (UNH) earnings are on Friday, July 14th, 2023, at 5:55am. United health Group (UNH) reported Q1 March 2023 earnings of 6.26 per share on revenue of 91.9 billion. The consensus earnings estimate was 6.24 per share on revenue of 89.8 billion. Revenue grew 14.7% on a year-over-year basis. The company said it expects 2023 earnings of 24.50 to 25.00 per share. The company's previous guidance was earnings of 24.40 to 24.90 per share and the current consensus earnings estimate is 24.91 per share for the year ending December 31, 2023.
I'm posting this as a long because of the entry price, risk : reward setup today on Monday 7/10/23. UNH has been trading in a wide sideways range in 2023.
2023
high = 537
low = 445
Q2 June 2023 Consensus:
EPS = 6.03
Revenue = 90.97 B
PE = 21.1
Options data:
7/14 expiry
Put Volume Total 1,323
Call Volume Total 2,131
Put/Call Volume Ratio 0.62
Put Open Interest Total 15,222
Call Open Interest Total 8,357
Put/Call Open Interest Ratio 1.82
7/21 expiry
Put Volume Total 453
Call Volume Total 769
Put/Call Volume Ratio 0.59
Put Open Interest Total 15,911
Call Open Interest Total 26,227
Put/Call Open Interest Ratio 0.61
8/18 expiry
Put Volume Total 912
Call Volume Total 952
Put/Call Volume Ratio 0.96
Put Open Interest Total 13,545
Call Open Interest Total 11,440
Put/Call Open Interest Ratio 1.18

UNH SHORTUNH broke down the trend line . My expectation for the price target in the WEEKLY chart are shown above on the chart.

8/25 Short Iron Condor Trade IdeaCredit TBD ~$150 - $250.
Collateral $500.
Order Summary:
BUY $510 Call 8/25
SELL $505 Call 8/25
--{current share price: $480}--
SELL $460 Put 8/25
BUY $455 Put 8/25
