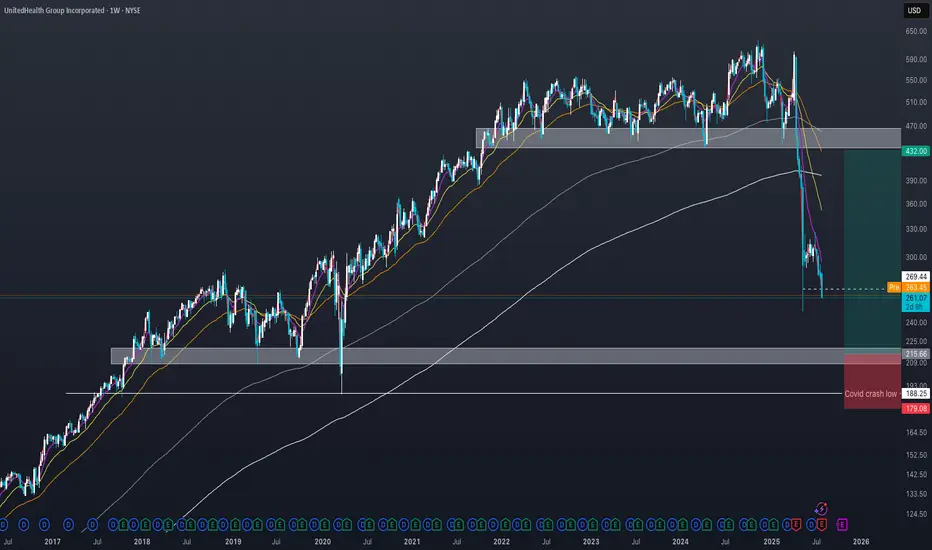
United Health - The perfect time to buy!⛑️United Health ( NYSE:UNH ) finished its massive drop:
🔎Analysis summary:
Over the past couple of months, United Health managed to drop an incredible -60%. This drop however was not unexpected and just the result of a retest of a massive resistance trendline. Considering the confluence of support though, a bullish reversal will emerge quite soon.
📝Levels to watch:
$250
SwingTraderPhil
SwingTrading.Simplified. | Investing.Simplified. | #LONGTERMVISION
UNHD trade ideas

My UNH Thesis: Betting on a Healthcare Giant's Come BackThe healthcare sector has been in decline, which creates interesting opportunities. I recently talked about a few pharma plays - Eli Lilly, Novo Nordisk, and Pfizer.
Here's why I'm investing in NYSE:UNH :
UnitedHealth Group (UNH) has tanked ~50% in the past year, but the July 29 (VERY SOON) earnings could flip the script. As a historically dominant player, UNH is now undervalued amid sector weakness, offering massive upside if regulatory fears ease.
Here's my full bull case. 👇 FUNDAMENTAL ANALYSIS
Why the Sell-Off? A Perfect Storm of Bad News
UNH crushed the market for 15 straight years (2009-2023) with positive returns, predictable EPS growth, and 134% gains over the last decade.
But 2024 brought chaos:
Feb: Massive cyber attack caused a one-time EPS hit (non-recurring).
Ongoing: DOJ antitrust probe, criminal fraud investigation, rising Medicare costs, and Optum losses.
April: Disastrous Q1 earnings miss + lowered guidance.
Leadership drama: CEO death.
This erased gains (down 7% over 5 years), amplified by healthcare sector outflows—the biggest since 2020. But is this overblown? Signs point to yes. The markets almost always overreact to bad news.
Bullish Signals: Insiders Betting Big
The tide is turning:
Insider Buying Boom: $32M+ in 2024 (vs. $6.6M in 2019), including new CEO/CFO—highest in 15 years.
Congress Buying: Q2 2024 saw net purchases for the first time in 5 years (vs. historical selling).
DOJ Shift: Probe refocusing on pharmacy benefits (PBM) unit, dropping acquisition/monopoly scrutiny—implies no major findings. Great news!
Sector Tailwinds: Healthcare is one of 3 S&P sectors below historical valuations. Super investors (usually tech-obsessed) are piling in, despite the sector's -10% YTD vs. S&P's +13%.
Plus, UNH's dividend yield is at a record ~3% (vs. 1.5% avg), with 16%+ historical growth and 100%+ free cash flow conversion. Rare combo of yield + growth!
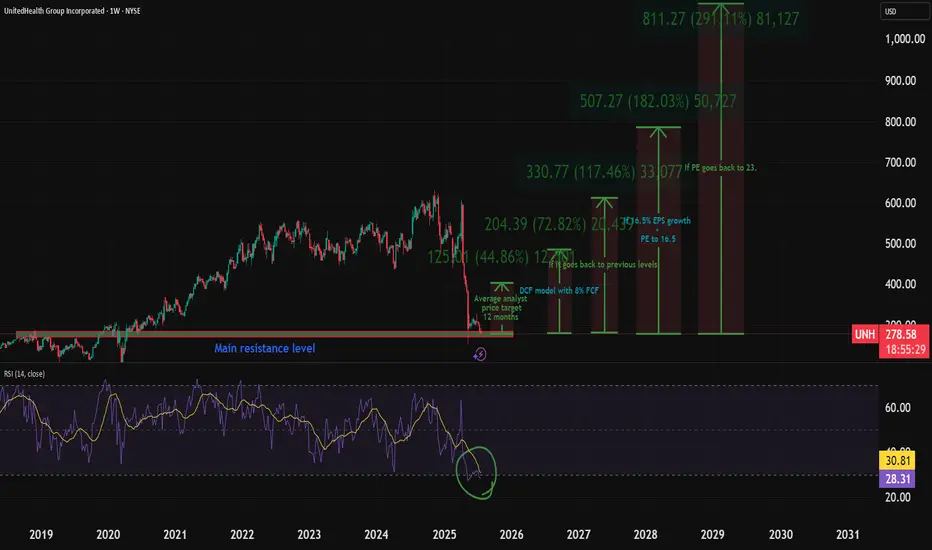
Valuation: Screaming Buy?
UNH trades at PE ~11.9 (vs. 10-year avg 23)—a steal.
Analysts project 16.7% EPS CAGR through 2029.
Conservative Scenario: 16.5% EPS growth + PE to 16.5 = $780/share by 2030 (173% total return, 18% CAGR ex-dividends).
Optimistic: PE back to 23 = $1,084/share (280% return).
Models confirm:
DCF (8% FCF growth): ~$484/share (70% upside).
DDM (7% div growth): ~$607/share (112% upside).
Blended Fair Value: ~$545/share (75-90% upside from ~$300). Buy below $436 for 20% safety margin.
Still, there is fear of DOJ uncertainty—investors hate unpredictability and that's why the stock is so low.
Key Catalyst: July 29 Earnings
This could be UNH's "most important report ever." Watch for:
Regulatory/legal updates (DOJ progress).
Full-year guidance revisions.
Metrics like medical loss ratio and PBM performance.
Positive news = potential rocket 🚀. Expectations are low (20 bearish EPS revisions vs. 0 bullish), so a beat could spark volatility... upward.
Risks: Not Without Bumps
Regulatory escalation (e.g., PBM issues) could tank it further.
Short-term headwinds: Medicare costs, sector selling.
Mitigants: DOJ de-risking, strong FCF buffer, insider confidence. Enter cautiously—size positions small.
TECHNICAL ANALYSIS
I also did a little technical analysis:
UNH price is at a resistance level
My EVaR indicator tells me we are in a low-risk area
RSI says the stock is oversold
I added the different price targets for better visualization
THE PLAN
My plan:
Later today, I will allocate 1% to 1.5% of my portfolio to the stock. If it drops, I will continue to DCA. The stock is already really beaten down, and I think a company this large cannot drop much more.
Quick note: I'm just sharing my journey - not financial advice! 😊
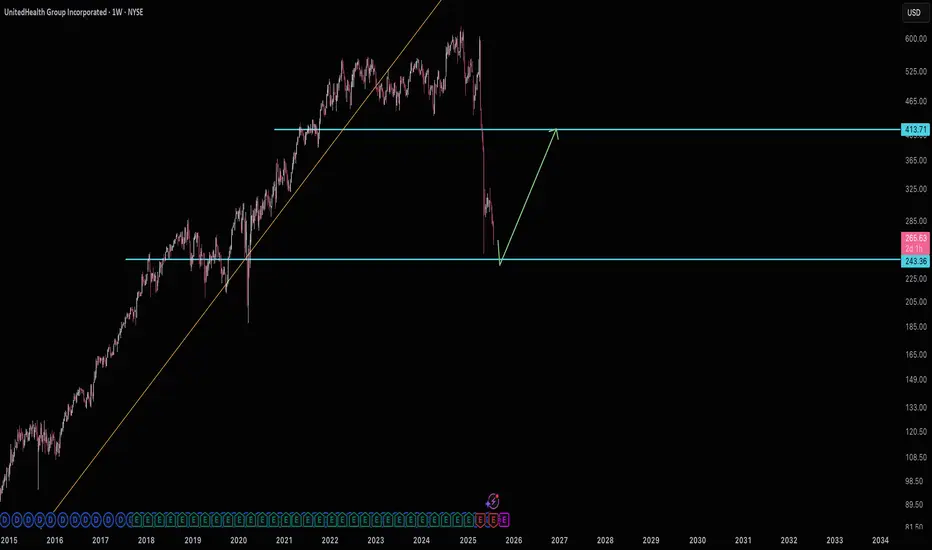
Waiting for $243 United HealthUNH has obviously taken a beating. It's managed to get so close to support many a few times now, yet hasn't hit yet. So if $243 does hit, then plan on targeting $410.
Good luck!
UNH Earnings Lotto Setup** (2025-07-28)
📊 **UNH Earnings Lotto Setup** (2025-07-28)
🎯 **Targeting a 2x return on post-earnings upside move**
---
### 💡 Trade Thesis:
**UnitedHealth (UNH)** is primed for a potential bounce on earnings:
* ✅ **Revenue Growth**: +9.8% YoY
* 🔥 **EPS Beat Rate**: 88% over last 8 quarters
* ⚠️ Margin compression risk from increased utilization
* 🧠 **Analyst Upgrades** trending positive
* 📉 RSI = **30.06** → Oversold territory
---
### 🔎 Options Flow & Technicals
* 🧲 Max Pain: **\$290**
* 🟢 Bullish call OI stacking at **\$285**
* ⚖️ IV Rank: **0.75** → Still has juice
* 🔻 Trading below 20D/50D MAs → Room for reversal
---
### 💰 Trade Setup
```json
{
"Instrument": "UNH",
"Direction": "Call (Long)",
"Strike": "$285",
"Entry Price": "$10.30",
"Profit Target": "$20.60 (2x)",
"Stop Loss": "$5.15 (50%)",
"Size": "1 contract",
"Expiry": "2025-08-01",
"Entry Timing": "Pre-Earnings Close (July 28)",
"Earnings Date": "2025-07-29 BMO",
"Expected Move": "±5%",
"Confidence": "70%"
}
```
---
### ⚖️ Risk/Reward
* Max Risk: 💸 \$1,030
* Max Gain: 🚀 \$1,030
* R/R Ratio: **1:2**
* Lotto-style with tight SL post-ER
---
### 🧭 Execution Plan
* 📅 Buy before close on **July 28**
* ⏰ Close same-day post ER **if target or SL hits**
* ❌ Exit manually if theta crush hits hard
---
### 🗣️ Final Note:
> “Oversold + Strong fundamentals + Positive consensus = Earnings bounce in the making.”
---
📌 Tag your UNH trades
💬 Drop your lotto setups
❤️ Like & repost if you're playing UNH this week!
\#UNH #EarningsPlay #OptionsTrading #TradingView #UNHEarnings #LottoTrade #CallOptions #HealthcareStocks #SwingTrade #RSI #IVRank #MaxPain

$UNH Fighting Back After Sharp DropCurrently at $265.46, NYSE:UNH is trading below both its 50-period SMA (~$270.00) and 200-period SMA (~$285.00) on the 30-minute chart. The stock found support at $260.00, where it staged a small bounce, but it remains under pressure with clear resistance at $312.29. The trend remains bearish until a stronger reversal emerges. Awaiting UltraBuy signal — charting tomorrow's giants with UltraAlgo.

UNH WEEKLY TRADE IDEA (07/27/2025)
**🚨 UNH WEEKLY TRADE IDEA (07/27/2025) 🚨**
**Trend: Bearish Bias with Contrarian Options Flow**
🟥 **Technical Breakdown** + 🟩 **Bullish Flow Confusion** = Strategic Put Play
---
📊 **Key Technicals**
🧭 **Daily RSI:** 37.0 ⬇️
📉 **Weekly RSI:** 27.9 ⬇️ = *EXTREME BEARISH MOMENTUM*
📊 **Volume:** 1.2x prior week = *Institutional activity confirmed*
---
📈 **Options Flow Snapshot**
🟢 **Call/Put Ratio:** 1.64 → Normally bullish…
❗BUT in a falling market = **Contrarian noise** (per Gemini & Claude)
---
🔍 **Model Consensus Recap**
✅ All 5 models confirm BEARISH MOMENTUM
📉 Volume confirms downward pressure
❗ Disagreement only on *interpretation* of bullish call flow
📌 **Conclusion:** Put trade favored, but watch for surprise reversals
---
💥 **RECOMMENDED TRADE SETUP (Confidence: 65%)**
🎯 **Play:** Buy-to-Open PUT
* **Strike**: \$270
* **Expiry**: Aug 1, 2025
* **Entry Price**: \~6.10
* **Profit Target**: \$12.00 (🔁 2x Gain)
* **Stop Loss**: \$3.00 (🔻\~50%)
📆 **Entry Timing:** Market Open Monday
📦 **Size:** 1 Contract
---
⚠️ **Key Risks to Monitor:**
* 📈 If UNH moves above \$290 (Max Pain), bearish thesis invalidates
* ⚡ Gamma risk increases mid-week — *manage actively!*
* 📉 Unexpected volume dry-up could stall momentum
---
📌 **JSON FORMAT TRADE DETAILS (For Scripts/Alerts):**
```json
{
"instrument": "UNH",
"direction": "put",
"strike": 270.0,
"expiry": "2025-08-01",
"confidence": 0.65,
"profit_target": 12.00,
"stop_loss": 3.00,
"size": 1,
"entry_price": 6.10,
"entry_timing": "open",
"signal_publish_time": "2025-07-27 20:30:45 EDT"
}
```
---
💡 Summary:
Bearish momentum confirmed across models.
Flow confusion ≠ fade setup — it’s a **calculated put play**.
Trade smart, stay sharp.
🎯 Watch \$290.
💬 Tag fellow traders → \ NYSE:UNH bears unite!
\#UNH #OptionsTrading #BearishSetup #UnusualOptions #GammaRisk #MaxPain #TradingView #StockMarket
UnitedHealth (UNH) Shares Plunge Following Earnings ReportUnitedHealth (UNH) Shares Plunge Following Earnings Report
Yesterday, prior to the opening of the main trading session, UnitedHealth released its quarterly results along with forward guidance. As a result, UNH shares dropped by over 7%, signalling deep disappointment among market participants. According to media reports:
→ Earnings per share came in at $4.08, missing analysts’ expectations of $4.48.
→ Revenue guidance was set at $445.5–448 billion, falling short of the anticipated $449.07 billion.
→ Concerns were further fuelled by rising costs and declining profitability, which the company attributed to the continued impact of Medicare funding cuts.
Consequently, the UNH share price dropped to its lowest level of 2025, last seen on 15 May.
Technical Analysis of UNH Stock Chart
In our end-of-May analysis, we updated the descending channel on the UNH stock chart and highlighted that following the recovery from the May low (marked by arrow 1), sellers could regain control. Since then:
→ Throughout June, the share price exhibited signs of supply-demand equilibrium around the psychological $300 level.
→ However, after an unsuccessful rally that formed peak A (which now resembles a bull trap), the balance shifted in favour of the bears. The price began to slide lower along the median line of the descending channel (illustrated by arrow 2).
This pattern was a red flag, particularly against the backdrop of a broadly rising equity market since the beginning of summer. Even if the bulls had hope, yesterday's candle could have completely extinguished it:
→ The session opened with a wide bearish gap.
→ During the day, bulls attempted a recovery, but failed — the candlestick closed at the daily low, leaving a long upper wick, a classic sign of selling pressure.
In this context, we could assume that:
→ Bears may seek to extend their advantage and test the year’s low;
→ The bearish gap area (highlighted in purple), reinforced by the descending channel’s median line, could act as resistance during any potential recovery.
At the same time, the $250 psychological level appears to be a strong support zone. This is backed by the 15 May bullish pin bar formed on record trading volumes — a potential sign of institutional interest in accumulating shares of this healthcare giant in anticipation of a long-term recovery.
This article represents the opinion of the Companies operating under the FXOpen brand only. It is not to be construed as an offer, solicitation, or recommendation with respect to products and services provided by the Companies operating under the FXOpen brand, nor is it to be considered financial advice.

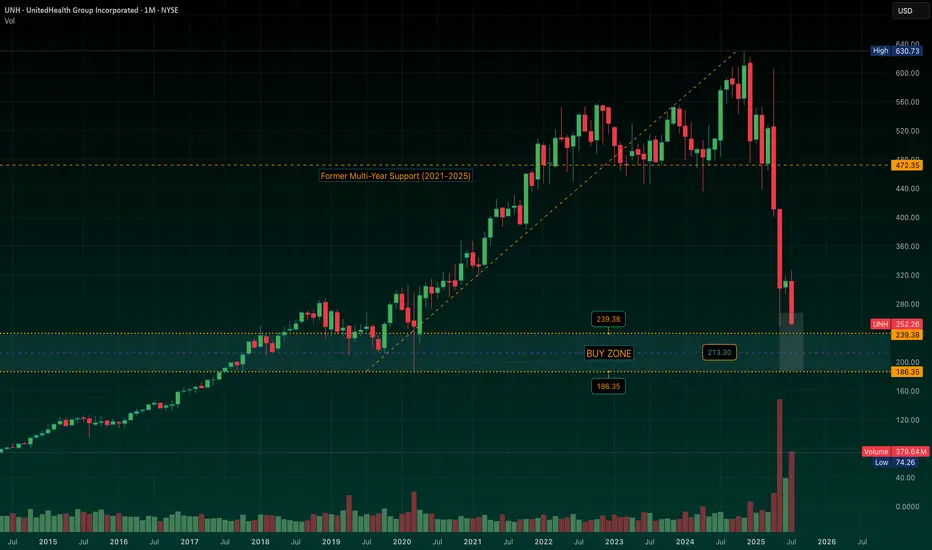
UNH: Mapping Out a Defined-Risk LEAPS Strategy in the "Buy Zone"UNH is approaching a broad structural support region I’ve been tracking -- a wide zone from $239 down to $186, where (for me) the stock begins to offer compelling risk/reward and long-term value. Momentum, IMO, is still decisively lower, but we’re nearing levels where I start preparing.
The midpoint of the “Buy Zone” near $213 reflects a potential average cost area I’d be very comfortable building from, depending on how price behaves as it enters the zone.
I’ll look to initiate exposure through long-dated call options (LEAPS) -- as I’ve started doing in NYSE:CNC -- once the setup begins to stabilize. From there, I’ll begin layering in short puts at ownership levels that align with the broader structure. If assigned, I’ll own where I intended. If not, I’m collecting premium to help finance the LEAPS.
I’m not in the business of calling exact bottoms… this is about building a position that respects time, structure, and flexibility -- anticipating a slow grind higher over the next 12–18 months. Stay tuned.
Bears are still in controlHello I am the Cafe Trader.
Today we are going to be taking a look at UNH. No doubt this has to have come across your feed or in the news recently. Why is every so Bullish? People are so bullish, that it spooks me... Everyone is pumping this emphatically, I feel like they are getting paid to pump it. This is a bold statement, but It's a gut feeling.
Tin Foil
If people get paid to pump, The huge seller isn't done selling, and needs you to keep buying to sell into you. Yes this should make you hesitant and weary. Does this mean you shouldn't buy? Not necessarily. Here are two scenarios to help you squeeze some juice out of this rock.
Bears are still in Control
A fresh new aggressive seller stepped in at $292.44. This is going to put some pressure on the high demand zone. May 25th, we sunk deep into the zone before recovering. This was an extremely hot reaction with passive buyers sitting at 271.30
11th of June aggressive buyers stepped in, but got crushed.
27th of June aggressive buyers stepped in, but as soon as they hit the real liquidity from the big seller (Tues jul 1st), you saw a huge follow through and more aggressive selling. This tells us that bears are still in control and I foresee two scenarios.
Green Scenario
Test off the liquidity at $271. Get a hot reaction from the buyers, putting tons of pressure on the new seller, ripping their faces and blasting off into never land.
Long
Entry 271
Stop 260
Partial TP 323
Final TP 425
Red Scenario
We test the New aggresor before the high demand Liquidity, get sold into heavily, and put so much pressure on buyers it blows pass the high demand and gets to the most probable bounce location at top of Extreme Demand $207.
Short
Entry 292
Stop 302.50
Partial TP 271
Final TP 207
Bonus Scenario
That 207 Area should attract massive buyers, even with the seller as heavy as he is. I think if there is going to be any big bounce strait off the cuff, this will be the spot.
Entry 207
Stop 185
TP 425 (play the long long game here)
Long Term
If you did your DD and you want a good price. The following will be measured by your personal sentiment.
Aggressive = 271
Fair price = 240
"Steal" = 191 - 207
That's all for UNH, Remember to follow/Boost.
Stay tuned for more market analysis. Happy Trading!
@thecafetrader

Buy when everyone is fearful UNH took a beating, earnings might surprise tomorrow. speculative pending positive earnings report. Target and stop loss on the chart.

NH SWING TRADE IDEA (2025-07-29)
### 🩻 UNH SWING TRADE IDEA (2025-07-29)
**UnitedHealth Group – Bearish Setup**
📉 **Sentiment:** Moderately Bearish
📊 **Daily RSI:** 28.9 (Oversold!)
📉 **Momentum:** 5D/10D bearish
🔇 **Volume:** Weak (1.0x avg = low conviction)
💬 **Options Flow:** Neutral (C/P = 1.00)
🌬️ **VIX:** 15.71 — calm, tradable
---
### 🔻 Trade Setup
* **Play Type:** Naked PUT
* **Strike:** \$240.00
* **Expiry:** 2025-08-15
* **Entry:** \$0.85
* **Target:** \$1.35
* **Stop:** \$0.60
* **Risk Size:** 1 contract
* **Entry Timing:** Market Open
* **Confidence:** 75% 📉
---
### 🤖 Model Consensus (5 Models)
✅ All agree: **Bearish RSI + Downward Momentum**
⚠️ Disagree on *strength* of the trend: moderate vs strong
💡 Models: Claude, Grok, Gemini, LLaMA, DeepSeek
---
### ⚠️ Key Risks
* Neutral options flow = no crowd confirmation
* Weak volume = price may stall or fake out
* Watch for VIX spikes — could flip sentiment fast
---
### 🔎 Summary for Swing Traders
**UNH \$240P → \$0.85 → \$1.35**
🧠 RSI confirms downside
⛔ Low volume = trade light, manage risk
📅 Target expiry: Aug 15
🧲 Key level: \$247.13 — if broken, ride lower

$UNH BEARISH SETUP – WEEK OF AUG 1
🔻 **\ NYSE:UNH BEARISH SETUP – WEEK OF AUG 1** 🔻
**UnitedHealth Group (UNH)** is showing classic breakdown signs. Here’s what the data says:
📉 **RSI Breakdown**
• Daily RSI: **20.6**
• Weekly RSI: **19.3**
→ Deeply oversold + no bounce = 🚨 momentum flush risk
📊 **Volume Surge**
• Weekly Volume: **145M** (1.9x avg)
→ Heavy **institutional selling**, NOT dip buying
🧠 **Options Insight**
• Call/Put Ratio: **1.17** = Slight bullish noise
• But... Expiry Gamma is 🚨HIGH = IV Crush incoming
• VIX: **20.7** = Volatility tailwinds intact
💣 **TRADE IDEA (PUT PLAY)**
• Direction: **BUY PUTS**
• Strike: **\$230**
• Expiry: **08/08/2025**
• Entry: **Monday Open**
• Target Premium: **\$0.10**
• 🎯 PT: \$0.30 | 🛑 SL: \$0.03
• Confidence: **70%**
📌 **Narrative**:
Oversold + High Volume Dump + No support bounce = Perfect storm for continuation dump. This is a high gamma play, time-sensitive, low-cost lotto setup. Risk small. Aim big.
---
💥 **Watchlist Tag**: ` NYSE:UNH AMEX:SPY AMEX:XLV `
🧠 **Strategy Tag**: #OversoldFlush #PutPlay #0DTETrap
🚀 Follow for more weekly earnings & options breakdowns!

UNH in trouble? Key support at $250 before deeper dropDear traders and followers,
the UnitedHealth group chart has been in a clear downtrend since mid-April, with a potential bottom forming around $250. If this level breaks, the next strong support lies in the $200–220 zone. This is my preferred entry zone
A stop-loss below the COVID crash low is advisable to manage risk. The stop-loss should be mental and only triggered if a weekly candle closes below the low.
Fundamentally the stock faces uncertainty due to ongoing lawsuits and potential policy changes under a Trump administration.
While UNH remains a strong long-term investment, the road back to the $400 level will likely be slow and challenging, requiring patience and resilience from investors.
UNH Long Setup BuildingStill expecting more downside. Area of interest isn't far—anchored VWAP, VAH, 0.75 fib, and a possible liquidity sweep all line up there.
Buying when others are fearful! - Technical breakdown looks ugly but biting the bullet with a strong conviction that bad news are priced in.
- Risk is to the upside. Even if it goes down, I'm mentally ready to buy more of NYSE:UNH and let it compound for years to come.
- I believe that we should close the gap above @ $376 so we have around 35-40% upside by the year end.
UNH Weekly Options Play – Bearish Setup (7/21/2025)
📉 UNH Weekly Options Play – Bearish Setup (7/21/2025)
RSI Breakdown 📊 | Institutional Hedging? 🤔 | Bearish Trend Confirmed 🚨
⸻
🧠 Multi-Model Analysis Summary
🔻 RSI Trends: Falling daily + weekly RSI → strong bearish momentum
📉 Volume: Consistently negative across models → confirms selling pressure
🧠 Options Flow: High Call/Put ratio (3.01) — debated as bullish hedge vs short cover
📌 Outcome: Consensus bearish, with minor short-term upside risk due to calls
⸻
🎯 TRADE IDEA – UNH $280 PUT
💥 Direction: Bearish
🧾 Strike: $280 Put
📆 Expiry: July 25, 2025
💵 Entry: $2.35
🛑 Stop: $1.18 (≈50% loss cap)
🎯 Target: $4.70 (≈100% gain)
📈 Confidence: 70%
⏰ Entry Time: Market Open
⸻
📎 Why Take This Trade?
✅ RSI + volume = bearish momentum confirmed
✅ Volatility is favorable for option premium expansion
❗️ Watch for gamma near expiry & unexpected institutional sentiment shifts
⸻
📊 TRADE_DETAILS JSON
{
"instrument": "UNH",
"direction": "put",
"strike": 280.0,
"expiry": "2025-07-25",
"confidence": 0.70,
"profit_target": 4.70,
"stop_loss": 1.18,
"size": 1,
"entry_price": 2.35,
"entry_timing": "open",
"signal_publish_time": "2025-07-21 12:49:28 EDT"
}
⸻
🔥 #UNH #OptionsTrade #BearishSetup #WeeklyTrade #PutOptions #InstitutionalFlow #MarketMomentum #VolatilityPlay

A BUY at $200?If this stock falls to $200, it's a great buy for the risk. Even a pullback to $300 would be a great return.

UNH : Are Bad Days Over ? (Cautious)UNH shares have moved above the 50-period moving average but are trading below the 200-period moving average.
For now, since the 200-period moving average is very high, a small trade can be tried by keeping the stop-loss level a little tight.
A few weak movements may pull the average down and the price may break the average.
Therefore, small position sizes are ideal.
NOTE : If we can maintain persistence on 376(Which will take a few days),
then we will look at the other gaps.
Risk/Reward Ratio : 2.39
Stop-Loss : 274.99
Take- Profit Level : 376.38
Regards.

Is it right time and choice to buy UNH Stock - {15/07/2025}Educational Analysis says that UNH Stock (USA) may give trend Trading opportunities from this range, according to my technical analysis.
Broker - NA
So, my analysis is based on a top-down approach from weekly to trend range to internal trend range.
So my analysis comprises of two structures: 1) Break of structure on weekly range and 2) Trading Range to fill the remaining fair value gap
Let's see what this Stock brings to the table for us in the future.
Please check the comment section to see how this turned out.
DISCLAIMER:-
This is not an entry signal. THIS IS FOR EDUCATIONAL PURPOSES ONLY.
I HAVE NO CONCERNS WITH YOUR PROFIT OR LOSS,
Happy Trading.

UNH bear flag and gapsUNH has been top of my radar for a bullish reversal. With 2 major gaps to fill after the epic collapse in share price this ticker has a lot of potential. Currently sitting in what appears to be a bear flag, it is holding above the monthly 200EMA (overlayed on this 4H chart). However price recently rejected off the daily 21ema (overlayed on this 4H chart) and if the bear flag is any indicator price may head lower for another liquidity sweep before the inevitable bullish reversal.
A side note: insiders have been buying $millions since the share price collapsed which is always a good indicator of what's to come.

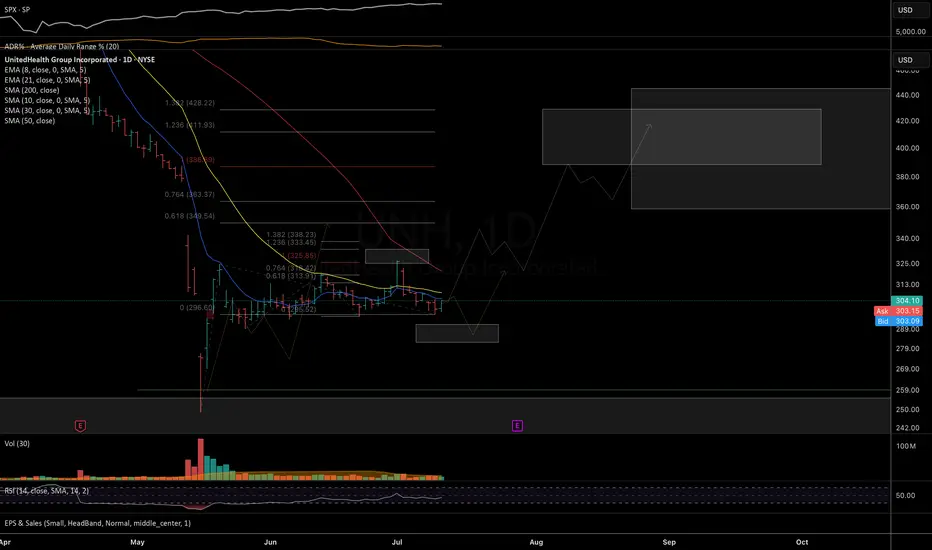
$UNH – Macro Outlook UpdateBack in April, I suggested the long-term uptrend from 2008 may have topped, shifting into a multi-year correction toward the 260–150 support zone. The decline unfolded faster than expected, with news-driven selling hitting the upper edge of that macro support — followed by a strong rebound.
Apr mind www.tradingview.com
Currently, price is consolidating constructively. As long as 282 holds, I favor a continuation higher into the 360–430 resistance zone where we’ll reassess the broader structure.
Daily chart
Macro chart
Thank you for your attention and I wish you successful trading and investing decisions!
Buy this stock if you want to get burnedThis isn't going to be a V shaped recovery y'all. Another leg down is on the way.

UNH... a double bottom would be niceso it doesn't have to happen, but I would love to see a double bottom around 245-250. it's just a technical idea that would give "ok we are ready to head back to 400." neckline would be 320-325.
watching and puts below 295. or rejects against 300.
