URBN 1D RANGE TRADERanges, Descending Triangles, Triangles and Ascending Triangle are repeatable trading chart patterns.
Ranges and Triangles are consolidation chart patterns that can breakout either direction.
Ascending and descending chart patterns will have a directional bias depending on the previous incoming trend.
Each chart pattern will have defining trendlines of the support/resistance levels creating the pattern.
What ever time frame you are trading this chart pattern, wait for a candle close outside of the trendline in the direction of the breakout candle. (Our time frame preference is the Daily chart).
Add volume indicator - Volume is the amount of $ that went into a particular candle or in Forex the # of trades that took place.
Add ATR indicator - Volatility is the amount of price movement that occurred. Use the ATR to measure the price movement.
When you see descending volume bars and descending atr line (which indicates volatility) this shows
a dis-interest in traders to invest in this pair creating consolidation which creates the chart pattern.
Trade Management after there is a breakout candle close.
1 - Position size (compare volume bar to volume ma line).
a - Breakout candle must be 100% of average volume for a full position size.
b - If 75% of average volume then ½ position size.
2 - Enter two trades.
3 - SL for both trades will be 1.5 x ATR.
4 - 1st trade TP will be 1 x ATR.
5 - No TP on 2nd trade – letting profit run and adjusting SL to follow price.
6 - When 1st TP hit – move 2nd trade SL to breakeven.
7 - Adjust the 2nd trade SL to follow price.
*8 - When breakout candle is more than 1 ATR from breakout candle open.
a - Enter 1st trade at candle close with ½ position size.
b - Enter 2nd trade with a pending limit order that is 1 ATR of breakout candle open.
c – Price should pullback to that pending limit order for 2nd trade.
d – If Price returns back into chart pattern close trade before SL is hit.
URBN trade ideas

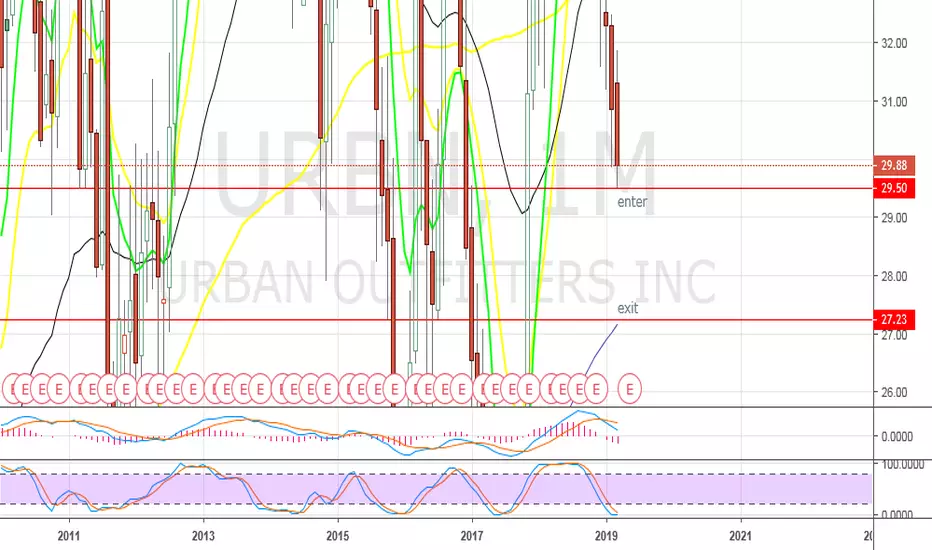
URBN Daily Trading RangeEntry Rules:
Buy URBN on a daily close above 24.25 or Sell on a daily close below 22.25
Volume on the breakout candle must be at least average volume to trade full size
If it doesn't reach the average volume, but reaches 75% of the average, use 1/2 size position.
If the volume doesn't reach 75% of the average, stand aside.
Stop loss is 1.5 x ATR on the breakout candle.
First target is 1 x ATR on the breakout candle.
Risk 2% of your account on this trade.
Trade Management:
If, after entry and before first target, a candle closes back in the range, close the trade.
On first target, close 1/2 of the position and move stop loss to break even on the second half.
Follow stops as the trade moves in your direction and let the market take you out.
These are my trade management rules, use whatever rules you prefer.
For more information about my trade management, go to: youtu.be


Closed bear call spread URBNMay 22 opened bear call spread 25/25.5 for $15 credit
reached profit target on May 29
Closed 5/28 $5 debit
$10 net profit

$URBN OPTIONS ACTIVITY POINTS TO $23 ON THE DOWNSIDEretail WRECKAGE HAS ENSUED TODAY AND IN OUR OPINION THAT WILL CONTINUE INTO THE EARNINGS REPORT FROM NASDAQ:URBN . ALREADY IN A MASSIVE DOWNTREND THE OPTIONS MARKET HAS BEEN ACTIVE WITH THE $23 PUTS STRIKE EXPIRING ON MAY 24TH . THEY STOCK HAS ALREADY LOST STRONG SUPPORT AT $27 NEXT STOP IS $23, $22 THEN $16. CURRENT SHORT INTEREST IS 16% AND WE EXPECT THAT TO INCREASE.
AVERAGE RECOMMENDATION OVERWEIGHT
AVERAGE PRICE TARGET $35
Company Description
Urban Outfitters, Inc. engages in the operation of a general consumer product retail and wholesale business selling to customers through various channels including retail locations, websites, catalogs and mobile applications. It operates through the Retail, and Wholesale segments. The Retail segment contains the Anthropologie, Bhldn, Free People, Terrain, and Urban Outfitters brands; and its Food and Beverage division. The Wholesale segment designs, develops, and markets apparel, intimates, active wear, and home goods under the Free People, Anthropologie, and Urban Outfitters brands.

$URBN URBAN OUTFITTERS GETS UPGRADES GALORE Urban Outfitters has a tremendous few weeks with very high bullish volume, ignited by analysts tripping over one another to release price upgrades, we think price will continue with the upturn in retail sentiment.


URBN - Trade setupLook for a break of the low on the pre market trading and then to the 200MA on the monthly chart.


URBAN outfitters longAgain, as per my forecast of Sept. 3rd , URBN could go long up to resistance area highlithed.
Buy at market open and TP from 47.72 to 48.50.
Stochastic is supporting this idea and SCTR is high enough for a buy.

URBAN OUTFITTERS BUYURBN could go long up to resistance area highlithed.
Buy at market open and TP from 47.72 to 48.50.
Stochastic is supporting this idea and SCTR is high enough for a buy.


$URBN TradeLooking to initiate a new position in $URBN with the pull back on decreased volume to daily support. Good risk, reward. Earnings upcoming end of August


OPENING: URBN MARCH 17TH 21.5/25.5/25.5/29.5 IRON FLY... for a 2.24 ($224)/contract credit. (High IVR/High IV; Post Earnings Volatility Contraction Play).
Metrics:
Max Profit: $224/contract
Max Loss/Buying Power Effect: $177/contract
Break Evens: 23.27/27.73
Theta: 6.12
Delta: -4.33
Notes: I'm looking to manage this at 25% max profit.

