VALE3 Possibe Upward Channel.In the next few days we will see Vale3 possible surpassing the resistance line and following the upward trend line. The opposite will occur if the value fall beyond the trend line, indicating a downfall until the support line.
VALED trade ideas

Ascending rectangle on ValeAscending rectangle broken with a decent volume level, sell order 9.13; stop loss 9.31; take profit 8.3

25,000 January 12 strike calls bought for .12 todayLarge size call buyer bets on bottom in VALE, looking for 50% upside by January expiration. 11.50 level was seen only few months ago. $7.50 support level is easy stop, if it breaks.

Just bounce over the uptrend support line in a weekly chartDespite the difficult political situacion in Brazil, VALE is bouncing over the support line

VALE - Bottomed and Going UpAlthough VALE is far from its 2008 highs of $44.xx, it seems that this Brazilian mining company has a history of v-shapped bottoms (or at least several days basing). The most recent highs of $11.71 and a bottom of $7.47 show that a FibR of .382 is $9.09, a .5% FibR of $9.59, and a .618% FibR of $10.09 - the relative sweet area of for those using FibR.
The last several days have hovered around the .236% FibR, all with bullish volume. Friday’s (5/26/2017) volume was to be expected due the long US weekend due to Memorial Day.
The daily MACD crossover since 5/10/2017 and Friday was the one of the first several closes above the 9dma and the 20dma.
The weekly chart shows a long legged doji for 5/15/2017 with a confirmation bullish candle the following week. The histograph on the MACD shows that the bears are starting to weaken. Weekly FibR at .5% is also $9.59. Would be a great +10% gain by mid-June.


VALE - weekly chart still looks promising.If you zoom out you can see the decline that VALE went through - I can imagine that further gains here are very well possible, even just as some sort of reverse to mean / fair value.


Buy VALE and hold.Forget about Iron Ore and TA, S11D proyect is on, tomorrow 27/04 earnings will be great. Hold until the fair price of $15 per share.

It can be very interesting to buy options at the price of 8Technical vision: Bullish structure where the retracement movement corresponding to a wave 4 is near to finish. Level 8 can be very interesting to buy options. Good luck and take care of your capital. Manage the risk.


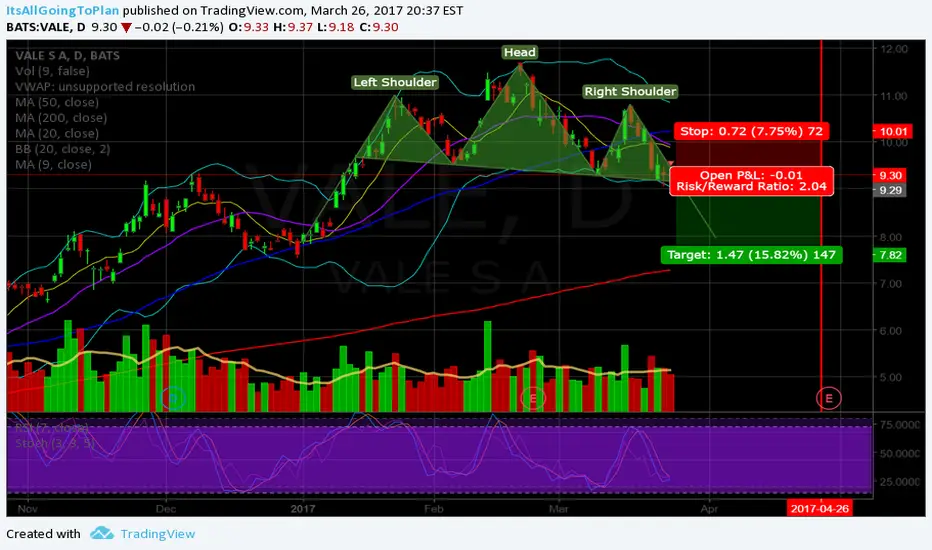
VALE H&S FormationAfter a nice uptrend, Vale has stalled and formed a Head and Shoulders pattern. Notice the volume on the uptrend to the "head", increasing right? But notice after the stock hit support for the second time (after forming the head) the second shoulder move up is rather mixed. Volume tells us a little bit more on moves up rather than moves down. You don't need increasing volume for a move down, it's nice and supports the argument, but it's not necessary.
Wait to buy until the stock moves below the blue support line with decent volume but more importantly ending the day near or at its daily low (shaven bottom). Stocks like to consolidate for a few days before moving down on patterns like this, so i would wait to see if the stock remains around the same price but Stoch & CCI indicators move higher.
Next major support is at the $8.00 mark (38.2% retrace), with a drop through that finding support at $7.50 then just below $7.00.


Counter-trend signals : VALE (Daily)Counter trend trades should fall in one of the two cases:
-> a quick and fast trade against the primary trend, expecting a pull back from the extremes.
-> reversal points
With that in mind, make sure you apply proper money management.


VALE Long IdeaHad a nice trade on this name today. Nice close as well so we might see a continuation to 12.00 area maybe 12.30. Earnings winner as well

VALE still going strong.. The trend is still strong.. some consolidation on the way though to target > 12.4.. Given the fact that the earning report on 23 of Feb is according to estimate $0.16

