Verizon May Be Rolling OverVerizon Communications has been rangebound for more than a year, and now some traders could think it’s rolling over.
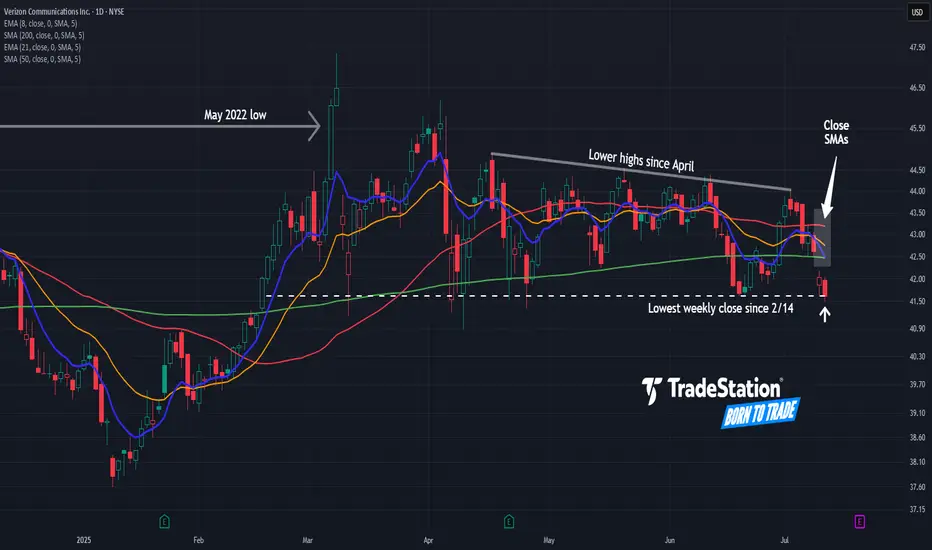
The first pattern on today’s chart is the May 2022 low of $45.55. VZ fell below that level in late 2022 and rebounded to it by mid-2024. The stock has been stuck below the same level since, including a rejection in March. Has old support become new resistance?
Second, prices have slipped below the 50- and 200-day simple moving averages (SMAs). The two SMAs are also close to each other. Those points may reflect weakening longer-term trends.
Third, the telecom stock has made lower highs since April -- even as the broader market broke out to new all-time highs.
Next, VZ just had its lowest weekly close since February. The 8-day exponential moving average (EMA) is also below the 21-day EMA. Those points may suggest that bearishness is taking hold in the short term.
TradeStation has, for decades, advanced the trading industry, providing access to stocks, options and futures. If you're born to trade, we could be for you. See our Overview for more.
Past performance, whether actual or indicated by historical tests of strategies, is no guarantee of future performance or success. There is a possibility that you may sustain a loss equal to or greater than your entire investment regardless of which asset class you trade (equities, options or futures); therefore, you should not invest or risk money that you cannot afford to lose. Online trading is not suitable for all investors. View the document titled Characteristics and Risks of Standardized Options at www.TradeStation.com . Before trading any asset class, customers must read the relevant risk disclosure statements on www.TradeStation.com . System access and trade placement and execution may be delayed or fail due to market volatility and volume, quote delays, system and software errors, Internet traffic, outages and other factors.
Securities and futures trading is offered to self-directed customers by TradeStation Securities, Inc., a broker-dealer registered with the Securities and Exchange Commission and a futures commission merchant licensed with the Commodity Futures Trading Commission). TradeStation Securities is a member of the Financial Industry Regulatory Authority, the National Futures Association, and a number of exchanges.
Options trading is not suitable for all investors. Your TradeStation Securities’ account application to trade options will be considered and approved or disapproved based on all relevant factors, including your trading experience. See www.TradeStation.com . Visit www.TradeStation.com for full details on the costs and fees associated with options.
Margin trading involves risks, and it is important that you fully understand those risks before trading on margin. The Margin Disclosure Statement outlines many of those risks, including that you can lose more funds than you deposit in your margin account; your brokerage firm can force the sale of securities in your account; your brokerage firm can sell your securities without contacting you; and you are not entitled to an extension of time on a margin call. Review the Margin Disclosure Statement at www.TradeStation.com .
TradeStation Securities, Inc. and TradeStation Technologies, Inc. are each wholly owned subsidiaries of TradeStation Group, Inc., both operating, and providing products and services, under the TradeStation brand and trademark. When applying for, or purchasing, accounts, subscriptions, products and services, it is important that you know which company you will be dealing with. Visit www.TradeStation.com for further important information explaining what this means.
VZ trade ideas
VZ: Verizon Earnings tomorrowwith 6% dividend yield and stock price at support level on the lower channel band, this draw attention to the earnings report tomorrow pre-market hours. Focused on future outlook as well.
If all good, I will buy VZ.
Disclaimer: This content is NOT a financial advise, it is for educational purpose only.

Where is Verizon headed next?Some quick points about the slight dip Verizon experienced over the past 5 trading days. Did bears step in and reject higher prices for VZ? Is the potential for a rally over?
In my opinion. No. But why you ask?
This stock trades relatively inverse to 10 year treasury yields. The 4 down days recently coincided exactly with 4 green days for 10 year yields. This is because if treasury prices fall, and thus yields go up, it makes Verizon theoretically less appealing because though you will generate less yield from treasuries, they are backed by the US government.
So in order for Verizon's yield to be more competitive with treasuries, naturally the price declines. When treasury yields drop, VZ can naturally rise, because the dividend can decline relative to price, and it's still appealing. This wasn't investors souring on Verizon, or the bears rejecting a rally, it was investors worrying about US debt repayment, and demanding higher interest payments from the government.
So why did yields spike for 4 days? The Big Beautiful Bill. Basically if the government borrows a bunch of money, and investors think that maybe there is a risk that they won't be able to pay them back, they demand a higher yield (treasury prices fall, and yields go up).
But if you ask me, that yield spike may already be over. The market tends to over-react to big news like this, and there are a few things happening right now that favor VZ going higher, I will list them below :
10 year yields have been trending down for months, they spiked, but only touched the top of the downtrend channel before retreating. They look poised to continue the downtrend for the second half of the week. Remember, the trend is your friend. Until yields break this channel convincingly and create an uptrend, you can assume they will continue downwards.
When tech stocks fall, yields tend to fall even faster, because investors seek the safety of treasuries to preserve capital and wait out the dip, which pushes bond prices up, and drives yields down (good for high dividend stocks like VZ).
Most tech stocks, and the QQQ ETF are looking very overbought. Earnings season is coming, but it looks like all of that action has already been priced in. There are bearish divergences appearing all over the place in tech stock RSI charts, I personally started closing out some positions already.
I'm still bullish on tech into the end of the year, but right now there is a lot of risk chasing the big names higher IMO. This is the longest stretch of days in 3 years without a 5-10% correction, which is already a red flag in itself. I won't be surprised to see some of the big names start to pull back as early as tomorrow, some of them have already begun to pull back. At least a minor correction looks highly probable, a deeper correction within the next few weeks.
10 Year Bond futures bounced and started climbing today (albeit, just a little, but in the right direction).
The market seems to be forgetting that US Treasury Sec. Scott Bessent's former job was literally selling US debt (driving yields down). He has made a career out of pushing yields down, and has stated it's his major goal with this administration. And like Elon said "if you are betting against the bond market, I think you are on the wrong side of that bet." (in short, this is a bullish theme for dividend stocks which are sensitive to yield fluctuations).
All in all, my thesis from previous posts remains. VZ is going higher, so long as 10 year yields don't rocket to all-time highs and stay there forever, and there is no apocalyptic earnings report, I see no reason why it won't.
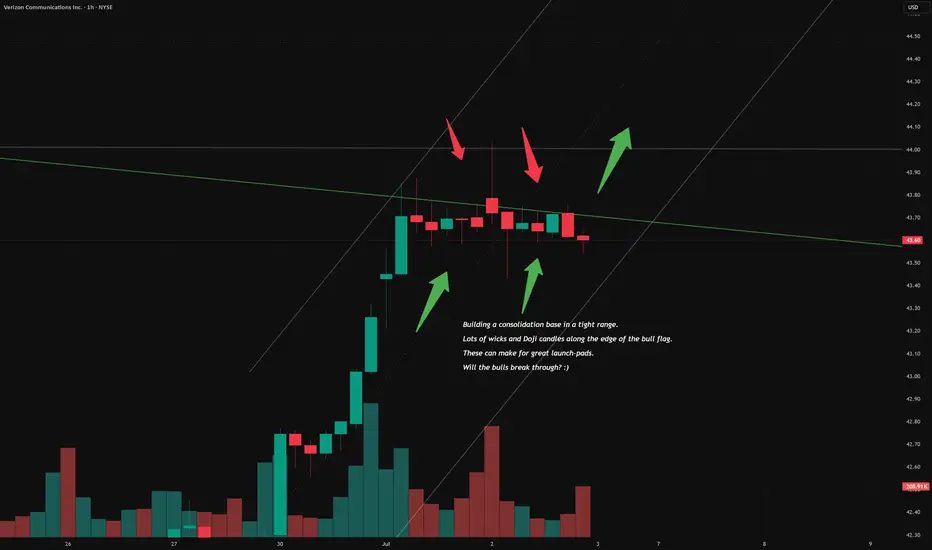
The battle has begun for VZ glory.Just taking a look at the hourly chart and it looks like the bulls broke through resistance, but the bears were able to push them back, for now at least. Every time the bears push the price down, the bulls push it right back up to the edge.
This is bullish IMO. It gives bears less liquidity to slow down the move upwards when the range is so tight. It will be interesting to see how things unfold.
Watch for high volume at the end of the session.
"The clock is ticking bears. Join us! JOIN THE LIGHT! DO IT FOR GLORY!" 🤣
Verizon to the Moon? - Click my Post on the 15-minute Chart!TradingView doesn't show a link to my 15-minute chart analysis from today on the daily timeframe, but you can find a comprehensive analysis in my profile.
I just wanted to add an idea here so people would be able to find it on this time-frame.
Either switch to 15-minute, or check my profile to get the full scoop!
Cheers!
Verizon has stepped onto the launch-pad! Let's GO!I posted about this setup last week, and so far it has played out exactly as I described. I wanted to give a little update based on todays price action. I will keep this short as I have provided the key points on the chart. But this is the 5-minute chart from todays session.
The stock appears to have stepped right onto the launch-pad and has put some major Option Strikes within striking distance before the week is out.
Tech stocks appear to be stepping back a bit (they were on average very overbought), and TLT (20 year treasury ETF) has staged a quiet rally in recent weeks.
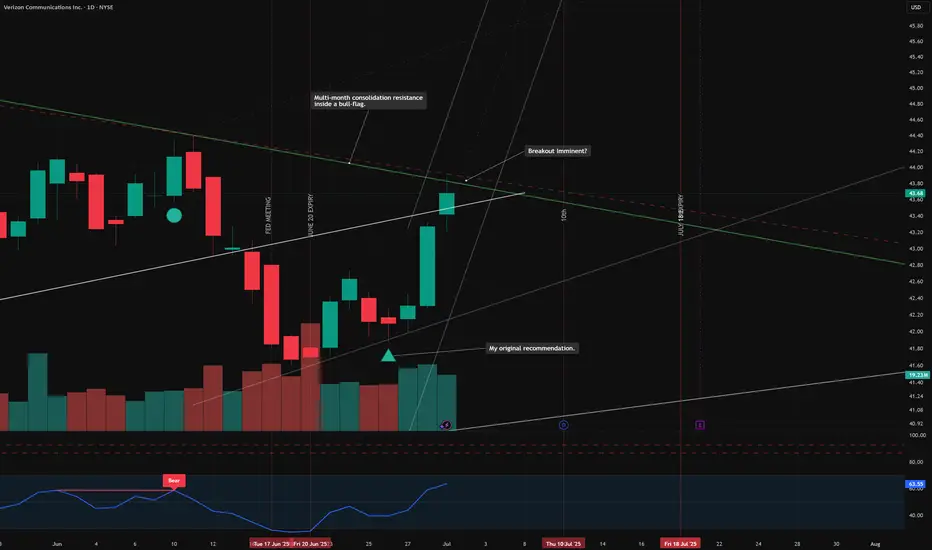
I think there is some major strength appearing in the bond market, despite the US tax bill, I think yields will ultimately trend down, and defensives (especially VZ) will perform well. I have upgraded my 2025 target from $47.50 to $53 after digging through the numbers a bit more, and after considering more potential rate cuts later this year.
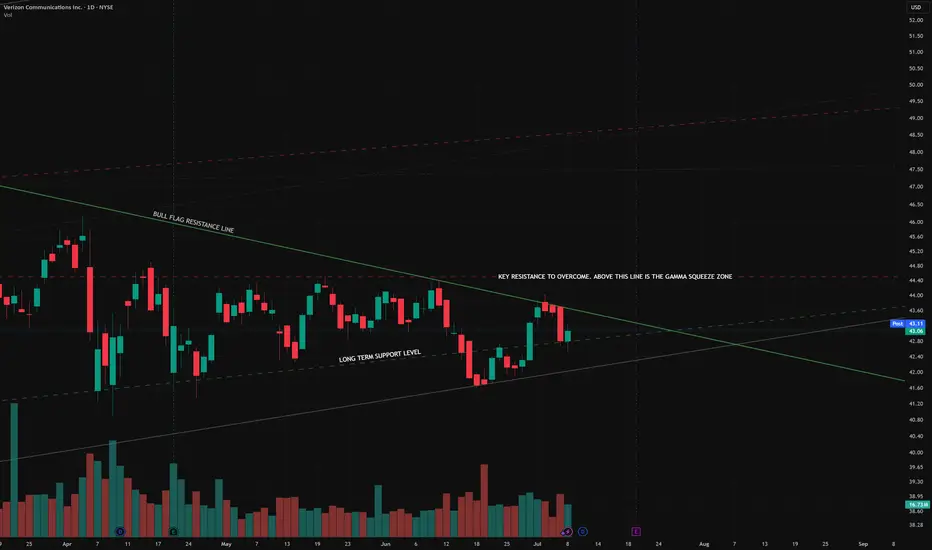
This will be VZ's 2nd test of the long-term bull-flag resistance, and it appears a breakout may be imminent. If the daily chart shows high volume and closes above that level this week, I think we're off to the races. Ignore this setup at your own peril :) I think it's a great opportunity, and regardless of what happens, this is a great stock to hold long-term. Currently paying a whopping 6.1%+ dividend.
A great addition for any dividend portfolio even at $53 (some analysts project higher, but I personally believe it may not go beyond that point until 2026 unless markets deteriorate or there is some other black swan event in 2025).
Good luck! Let me know if you have any questions. Cheers!

Verizon is ready to pop!This stock rallies when 10-year yields fall. Especially if tech stocks take a breather. Tech stocks are on average well into over-bought territory, and 10-year yields have been falling precipitously. Verizon is highly stable and provides a massive dividend which investors flock to when yields fall, currently sitting at about 50% higher than 10 year treasury notes.
Combine that with all of the technical indications like the multi-week consolidation inside a bull flag has primed VZ to break out, and you have a great setup.
A liquidity sweep has taken place, and it appears the next target for the stock is around $47.50, in-line with most analyst estimates.
Call options on July 18 strikes have very high OI. As price moves through these strikes, a rally could ensue. Prior rallies average 10-20%, and typically the stock rallies prior to the Ex Dividend date, which is on July 10th. The stars appear to be aligning on this one.

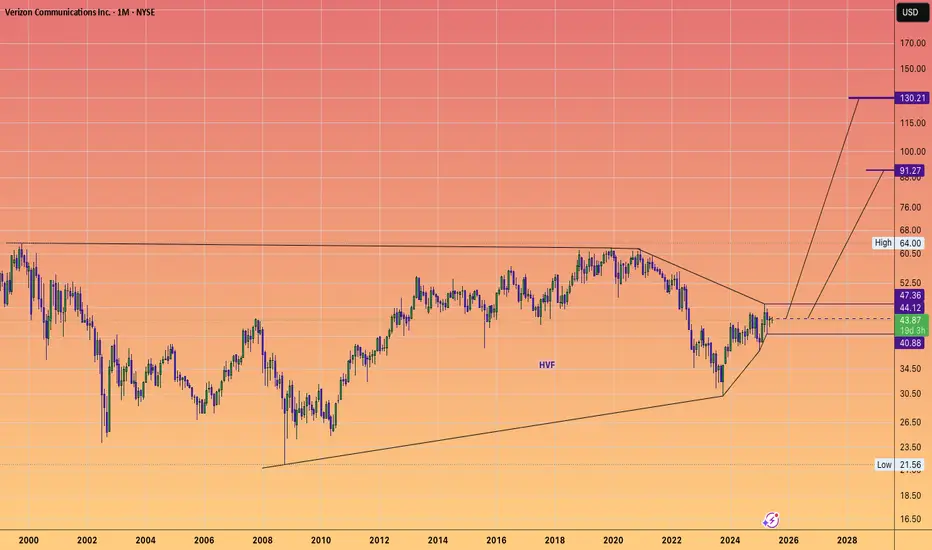
VERIZON will run up to $130It's not me
it's the chart that says it will
#HVF
#HuntVolatiltyFunnel
@FrancisHunt-TheMarketSnipe
@TheMarketSniper
@TheCryptoSniper
VZ - DO YOU SEE IT? Verizon its saying helllo!
A peaka-boo breakout on the daily chart is being observed.
This stock has coiled in a tight multi week range for a long time and is ready to explode higher if this breakout holds.
Typically a boring name that doesn't do much but when it starts to trend it can really go!
I'm looking at continuation long & upside calls.
This could head to $55 OVER THE NEXT FEW MONTHS.

VZ Weekly Trade Plan – 2025-06-08🧾 VZ Weekly Trade Plan – 2025-06-08
Bias: Moderately Bearish
Timeframe: 1 week
Catalysts: Dividend optimism vs. MACD weakness
Trade Type: Short-term directional put
🧠 Model Summary Table
Model Direction Entry Strike Option Type Target Stop Confidence
Grok Moderately Bullish $0.35 (ask) $44.00 Call $0.70 (100%) $0.175 65%
Claude Moderately Bearish $0.52 (ask) $44.00 Put $0.75–0.78 $0.31 72%
Llama Slightly Bearish $0.29 (ask) $43.50 Put $0.435 (50%) Collapse >$44.50 68%
Gemini Moderately Bearish ~$0.28 (ask) $43.50 Put $0.45–0.50 $0.18 60%
DeepSeek Moderately Bullish $0.35 (ask) $44.00 Call $0.70 (100%) $0.18 65%
✅ Consensus Bias: Slight Bearish Lean (3 of 5 models bearish)
⚠️ Key Disagreements: Directional outlook (calls vs. puts); strike selection; volatility interpretation
🔍 Technical & Sentiment Summary
Trend: VZ is above key EMAs on multiple timeframes
Momentum: RSI neutral (~54); MACD mixed/bearish on intraday; bulls see recovery
Volatility: VIX ~16.8 (low), supporting slow-paced price action
Max Pain: $43.50 (anchor magnet); current price ~ $43.80
Sentiment: Positive dividend news supports bulls; short-term MACD and resistance (44.12) support bears
✅ Final Trade Recommendation
Parameter Value
Instrument VZ (Verizon)
Strategy PUT (SHORT)
Strike 43.50
Entry Price $0.29 (ask)
Profit Target $0.45 (≈55% gain)
Stop-Loss $0.18 (≈38% loss)
Expiration 2025-06-13 (Weekly, 5 DTE)
Size 1 contract
Confidence 67%
Entry Timing Market open
🎯 Rationale: Max pain magnet + weak MACD on multiple intraday timeframes provide opportunity for a quick pullback toward support.
⚠️ Key Risks
Dividend strength may act as a floor near $43.50–$43.60
Break above $44.00 invalidates bearish trade thesis
Gamma risk: late-week price stalling can crush premium
Low volatility could slow down option movement → be time-sensitive
📊 TRADE DETAILS SNAPSHOT
🎯 Instrument: VZ
🔀 Direction: PUT (SHORT)
💵 Entry Price: 0.29
🎯 Profit Target: 0.45
🛑 Stop Loss: 0.18
📅 Expiry: 2025-06-13
📏 Size: 1
📈 Confidence: 67%
⏰ Entry Timing: open
🕒 Signal Time: 2025-06-08 23:35:04 EDT

VZ - WHERE ARE YOU HEADING?Good Morning,
Hope all is well. As you can see we have VZ flip flopping in a consolidation zone. A break above resistance bullish, a break below support bearish. There was a gap created nearing the end of the last bull wave into a correction. This gap was then filled however VZ failed to maintain momentum and is now in a consolidation zone. From the way VZ dropped into consolidation & also fell below the 4th wave on the last bullish run, my bets is on a further downtrend to lower lows.
Enjoy!

VZ - Verizon Communications Inc. (45 minutes chart, NYSE) - LongVZ - Verizon Communications Inc. (45 minutes chart, NYSE) - Long Position; Short-term research idea.
Risk assessment: High {volatility risk}
Risk/Reward ratio ~ 2.08
Current Market Price (CMP) ~ 44.17
Entry limit ~ 44 to 43.60 (Avg. - 43.8) on May 07, 2025
1. Target limit ~ 44.35 (+1.26%; +0.55 points)
2. Target limit ~ 44.80 (+2.28%; +1 point)
3. Target limit ~ 45.15 (+3.08%; +1.35 points)
Stop order limit ~ 43.15 (-1.48%; -0.65 points)
Disclaimer: Investments in securities markets are subject to market risks. All information presented in this group is strictly for reference and personal study purposes only and is not a recommendation and/or a solicitation to act upon under any interpretation of the letter.
LEGEND:
{curly brackets} = observations
= important updates
(parentheses) = information
~ tilde/approximation = variable value
-hyphen = fixed value

Good Entry - Earnings Sell OffGood entry here. Long term addition or swing trade. Added VZ long position

Eminent GEO Completion at CROW Code TGOEminent GEO Completion at CROW Code TGO:
Looking at imminent completion of the GEO's 5-point formation, preceding event to 1-4 TL validation.
CROW Code targets, as of today (23 OCT 2018):
1 - TGO = 59.12
2 - TGB = 67.71
AND
3 - TGU = 74.87
$VS/Monthly:
GEO:
1 - 1-2 Line Symmetry (1-2 SYM)
2 - 2-3 Line Complex Zig-Zag Formation (2-3 CZF)
3 - 3-4 Line Simple Zig-Zag Formation (3-4 SZF)
4 - 1-4 Line Tunneling Formation (3-4 TUN)
5 - 1-4 Target Line (1-34 TL)
Risk Lines:
1 - TGO to 1-4TL to TGU
OR
2 - TGO to TGB to 1-4TL to TGU
4xForecaster

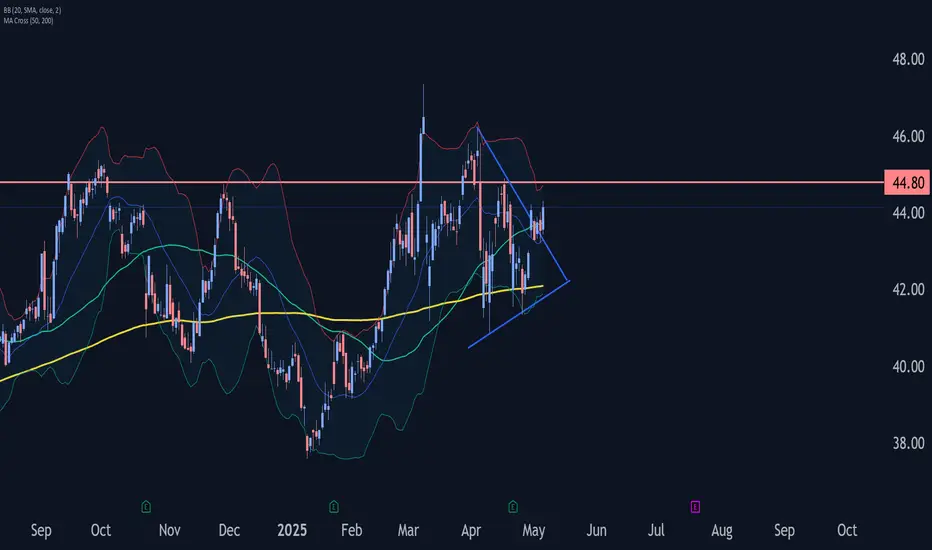
Verizon Wave Analysis – 6 May 2025
- Verizon broke daily Triangle
- Likely to rise to resistance level 44.80
Verizon recently broke the resistance trendline of the daily Triangle from the start of April (which has enclosed the previous waves B, i and ii).
The breakout of this Triangle should accelerate the active impulse wave iii, which belongs to the C-wave from last month.
Verizon can be expected to rise to the next resistance level 44.80 (top of the previous impulse wave (i) from last month).
Verizon stock Chart Fibonacci Analysis 043025Trading Idea
1) Find a FIBO slingshot
2) Check FIBO 61.80% level
3) Entry Point > 44/61.80%
Chart time frame: D
A) 15 min(1W-3M)
B) 1 hr(3M-6M)
C) 4 hr(6M-1year)
D) 1 day(1-3years)
Stock progress: A
A) Keep rising over 61.80% resistance
B) 61.80% resistance
C) 61.80% support
D) Hit the bottom
E) Hit the top
Stocks rise as they rise from support and fall from resistance. Our goal is to find a low support point and enter. It can be referred to as buying at the pullback point. The pullback point can be found with a Fibonacci extension of 61.80%. This is a step to find entry level. 1) Find a triangle (Fibonacci Speed Fan Line) that connects the high (resistance) and low (support) points of the stock in progress, where it is continuously expressed as a Slingshot, 2) and create a Fibonacci extension level for the first rising wave from the start point of slingshot pattern.
When the current price goes over 61.80% level , that can be a good entry point, especially if the SMA 100 and 200 curves are gathered together at 61.80%, it is a very good entry point.
As a great help, tradingview provides these Fibonacci speed fan lines and extension levels with ease. So if you use the Fibonacci fan line, the extension level, and the SMA 100/200 curve well, you can find an entry point for the stock market. At least you have to enter at this low point to avoid trading failure, and if you are skilled at entering this low point, with fibonacci6180 technique, your reading skill to chart will be greatly improved.
If you want to do day trading, please set the time frame to 5 minutes or 15 minutes, and you will see many of the low point of rising stocks.
If want to prefer long term range trading, you can set the time frame to 1 hr or 1 day.

Verizon Shares Tank 4% In premarket Amidst Earnings ReportsVerizon Communications Inc., (NYSE: NYSE:VZ ) through its subsidiaries, engages in the provision of communications, technology, information, and entertainment products and services to consumers, businesses, and governmental entities worldwide saw it's shares dip nearly 5% in Tuesday's premarket session.
Verizon Communications (NYSE: NYSE:VZ ) reported a wider-than-estimated drop in phone subscribers outweighing first-quarter results that topped analysts' expectations.
The company posted adjusted earnings per share (EPS) of $1.19 on operating revenue of $33.49 billion. Analysts polled by Visible Alpha expected $1.15 and $33.33 billion, respectively.
Furthermore, the company reported retail postpaid phone net losses of 289,000 subscribers. Analysts were expecting a net loss of about 218,000 subscribers.
Verizon Chief Revenue Officer Frank Boulben said Last month at a conference that new subscriber figures in the quarter were "probably going to be soft," although he affirmed the company's forecast for wireless service revenue to grow by 2% to 2.8% this year.
Shares dropped nearly 5% immediately after the report. They entered the day up about 7% this year.
Shares of Verizon ( NYSE:VZ ) is close to breaking the strong support point holding the asset from nosediving. Should NYSE:VZ break below the $40 support? A selling spree might push shares of Verizon to the $37 support point.
However, all eyes are on the RSI at 42, should NYSE:VZ hold the bears from entering oversold region, a bullish reversal might evolved in the short to long term.

VZ Trade LevelsI'm not mad at this for a swing trade!
The chart is leaning bearish. Would like to see a reject at the trend line or entry below 44.22.

VZ - Cup and handleMaybe, VZ completed the cup and handle pattern. Now, waiting break out of the resistant at 43.19 one more time, then retest, then uptrend.
Target $59.45
Now, $42.92 (04.10.2025).
IMO amateur trader.

VZ - Increased Probability of AppreciationThe alignment and compression of FiboNuvens providing support to the candles indicate an increased probability of appreciation, at least toward the first target. Upon reaching this target, with the stop-loss moved to the entry position, we can attempt to reach the final target. This strategy should secure the achieved result while drastically reducing the risk of loss in the trade.
Let’s see how this plays out! Follow this profile to track this trade and get updates on this and other ongoing opportunities.

VZ - Can you hear me now? Some interesting news while market is getting a pullback. Think we can hit my targets?
Market Chatter: Verizon $2.4 Billion Contract Close to Be Nixed by FAA in Favor of Starlink
Verizon Communications Insider Sold Shares Worth $437,939, According to a Recent SEC Filing

$VZ Trade Analysis DarkPoolsLet's analyze the provided chart of Verizon Communications Inc. (VZ) on the daily timeframe and break it down systematically to understand its current trend, key levels, and potential trade setups.
1. Trend Analysis:
Moving Averages:
The stock is trading above the 8 EMA (yellow line) and 21 EMA (blue line), indicating a bullish trend.
The price recently moved above the 200 EMA (dotted purple line), further confirming momentum.
Price Action:
The stock had a strong breakout from a previous consolidation range.
A series of higher highs and higher lows suggests the uptrend is continuing.
The last few daily candles show strong bullish momentum with large-bodied candles.
2. Key Support and Resistance Levels:
Dark Pool Levels (White Dashed Lines):
BB SW: 39.50 (A significant area where large institutional orders were executed.)
BA SW: 41.25 (A more recent Dark Pool level, which is now acting as a support level.)
Pivot Levels & Resistance Areas:
R1: 40.99 (Already broken, now acting as support.)
R2: 42.58 (Next potential resistance.)
R3: 44.28 (A major target if momentum continues.)
R5: 42.84 (Another high-level resistance.)
Support Levels:
S1: 39.09
S2: 38.79
S3: 38.48
S4: 37.58 (Major support and invalidation level.)
3. Trade Plan & Strategy
A. Bullish Trade Idea (Momentum Play)
📈 Entry: If the price holds above 41.25 (Dark Pool Level) and re-tests successfully.
🎯 Profit Targets:
42.58 (R2 Pivot Level) – Short-Term Target
44.28 (R3 Pivot Level) – Extended Target
44.84 (R5 Level) – Full Bullish Breakout Target
🛑 Stop Loss:
Below 40.49 (21 EMA & previous resistance now support)
Aggressive Stop: Below 41.25 (invalidates momentum)
Conservative Stop: Below 39.50 (breaks key Dark Pool level)
B. Bearish Reversal Play (If Price Fails at Resistance)
📉 Entry: If the price rejects 42.58 and shows weakness.
🎯 Profit Targets:
41.25 (Dark Pool Level) – First Target
40.49 (21 EMA) – Extended Target
39.50 (BB SW Dark Pool Level) – Full Target
🛑 Stop Loss:
Above 42.84 (R5 Pivot Level)
4. Conclusion & Prediction
Primary Expectation: Bullish continuation if price holds above 41.25 with targets at 42.58 and 44.28.
Risk Consideration: A break below 41.25 and 39.50 would signal potential weakness.
Final Thought: Institutional buying (Dark Pool activity) at 39.50 and 41.25 suggests strong accumulation. If volume sustains, this move could push VZ towards 44+ in the coming weeks.

Upgoing Zigzag on Verizon. VZA very suggestive bullish engulfing again. Single, isolated Japanese candles are meaningless by themselves. But when taken in context, they can paint a meaningful picture, as in this case.
