Wells Fargo & Co - WFC - Daily -Sometimes a picture tells it allSometimes all you need to do is to see a picture to know what to do....
Agree??
WFCD trade ideas

Wells Fargo - WFC - Daily - DOUBLE-TOP & DOUBLE H&S TOPChartists might look back on this someday .....
A rare event.
Tim
3:56PM EST 10/7/2014 51.09 last WFC

WFC. DailyA symmetric Wolfe Waves 5 potential and projection.
Rising Wedge, 3 drives potential. AB=CD.
Support 50,100 sma turn up base.
OBV/Volume nice arc valley shape. RSI bullish.
Targets in descending probability.
Target_1 : 52.70
Target_2 : 53.60
Target_3 : 54.50

Wells Fargo -WFC - Daily - One year Trendline is breakingSell.
Risk 2 average trading ranges.
Target 3-5 average trading ranges.
Tim 11:40AM EST 10/2/2014

$WFC look out below!Overall picture appears to be distribution like MANY MANY equities, but distribution takes time... so Important to outline each leg and understand where strong bounces will most likely occur.

Wells Fargo & Company - WFC - Daily - Bearish Rel Str & TopWFC has made lower highs since July while the overall market has made higher highs. When the leading group, financials, stop leading AND have a bearish chart pattern all by themselves, then it is a sign of trouble ahead for the S&P500 as well as being a bearish sign for WFC by itself.
Short WFC with 5% downside potential to $49.50. Stop $52.10. Last $51.38
Tim 2:04PM EST 9/2/2014 Tuesday

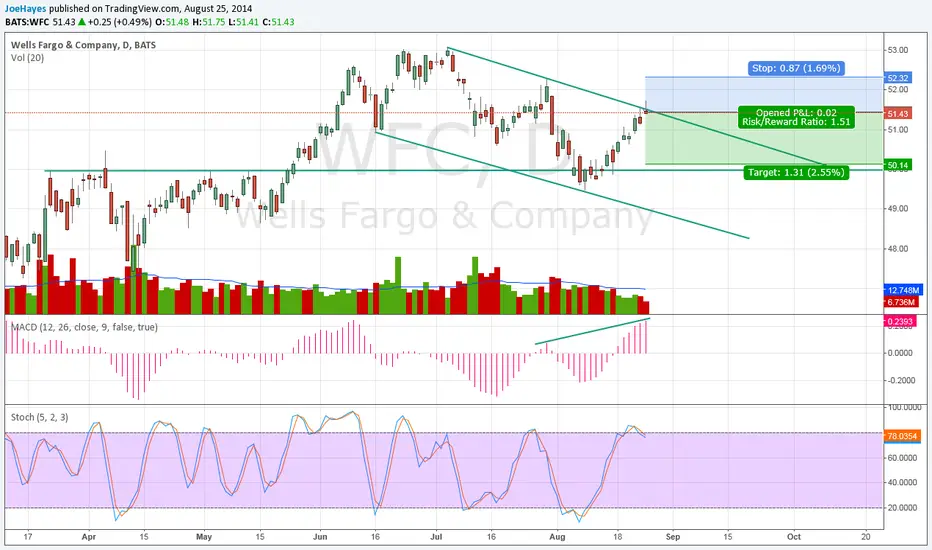
WFC Rejected at Trend LineWFC bouncing off trend line yesterday and today again to form a shooting star. There is some hidden bearish momentum divergence seen on the histogram, and the stochastic is coming out of overbought levels without price having broken the previous swing point high. This does look like a bull flag forming, but I am looking for one more move down to retest support before the next move up. Profit target right in front of support for a healthy 1:1.5 R/R ratio.
ABC To The DownsideOnce an issue breaks to the downside (A) there comes a time where we get a snapback rally bear channel (trendlines, B). upon the completion of the B wave in most cases its bombs away to the downside.

Bearish setup for $WFC$WFC has been downgraded from Buy to Hold by some analyst. I am expecting WFC dive to $49 -$47 area. yesterday daily bearish bar is good reason for bearish move.


Trading The Fattest Cat On The Street, Wells Fargo & Co (NYSE:WFThe fattest cat on Wall St. seems to be flying a bit under the radar these days. Wells Fargo & Co (NYSE:WFC) has been quietly rising to become the biggest banks in the world by market cap during 2014. Surprised? Well check out these stats...
Considered one of the most conservative banks in the United States, Wells Fargo & Co (NYSE:WFC) has moved up from fourth in the rankings of world's largest banks by market cap in April of 2013, to number one during 2014. The market cap of Wells Fargo & Co (NYSE:WFC) is now almost three and a half times the market cap value of the all mighty, Goldman Sachs Group Inc (NYSE:GS).
Wells Fargo & Co (NYSE:WFC) has had an amazing come back from the Financial Crisis of 2007; it is now number one, with more than fifty billion separating it from the number two, JPMorgan Chase & Co. (NYSE:JPM).
Recently, the media has started to pick up on this and the hype surrounding the name increases by the day. However, as traders all we are concerned with is should we be buying or selling the equity now. More importantly, where will Wells Fargo & Co (NYSE:WFC) be trading a few months or even a year from now.
Perhaps you missed the move WFC has had, now you are considering buying it. Well, lets look to the chart to tell us where the best place to enter this trade would be...
By doing some simple trend line analysis, we can see that Wells Fargo & Co (NYSE:WFC) has come into some major historical resistance as noted in the monthly chart above. Pretty much anyone looking at this chart would agree that this equity is extremely extended and should not be bought at current prices. In fact if Wells Fargo & Co (NYSE:WFC) closes at or below $51.00 by the end of June, it could be considered as a potential short candidate depending on other technical factors in consideration at that time.
The price level for those interested in buying and holding Wells Fargo & Co (NYSE:WFC) for a longer term move will be $41.18. If the stock should fall into this level without any consolidation above, it will represent a natural correction level, and buying opportunity. Remember that only a few years ago this equity traded as low as $7.80, you do not want to be the one holding the bag as institutions slowly begin to take their profits.

WFC technical topping formation - chart onlyThere are some suspect days in WFC stock where volumes were high on down days, but show up as green bars because the close was above the open. The breakout pattern from early this year appears to be a fake-out, break-out pattern and it was used to liquidate huge positions of stock by big position holders.
Fundamentals will likely follow, but the technicals indicate a low-risk, high-reward trade setup scenario.
See chart for details.
Tim 9:33AM 2/27/14 45.94 last on a down gap open

Fake-Out Breakout in Wells Fargo WFCRisk 1 point to make 1 points on this setup.
I think 44.5 will bring in some buyers so I'm just shooting for that target.
If WFC opens up 0.50, then the odds are better, as my risk is only 0.50 and my target is 1.50 away (3:1).
Longer term, I think this is a major warning sign that this breakout occurred on low volume. Note the high volume days - actually one was a down day (lower-low, and lower-high).
Note also the 200-day moving average is represented as a range since it uses the highs for one line and the lows for the other.
Tim 9:29AM EST, Monday, Feb 3, 2014

Was Wells Fargo Q4 earnings day a good day to go long?goo.gl This is my trading strategy should I have traded Wells Fargo stock yesterday after the earnings announcement.
> Wells Fargo stock is trending upwards. The stock price pulls back about 50% before it prints a new higher top during the past 4 months. I don’t normally draw such an obvious trendline, but I’m including it for illustration purposes here.
> The stock is trading higher than the significant resistance level at $44.75, which used to be the 6-month high till December. The breakout that occurred on December 18 sent Wells Fargo stock price to $45 during a day, when bulls controlled the market throughout the session. That explains the long green body of that specific day’s candlestick.
> WFC stock pulled back to $45. That level will probably provide support to future retracements.
Just another trend-following example, entering the market on each pullback.


WFC is rolling over with 39 then 36 possible by year endMaybe technicians will also call this a head&shoulders top formation, but either way you look at it - it is running into selling pressure and the stock is being "distributed" by long term holders. The new buyers are being tested here to see if they can absorb all of the selling pressure from the long term profit-takers.
This "forecast" may be a bit on the extreme side of the forecast as I drew the top line first, then the bottom line. However, I doubt it will get to the "massive support level" I have labeled - but at least a move towards it into the end of the year would make sense to me.
Risk: 3 Average Daily Ranges (11-day avg of high-low true range).
As for the whole market: Here is a simple pattern that has been useful to follow for decades.
The usual pattern is: First goes the bond market (down big this year), then banks and financials follow, then industrials, then transportation, then everything else. Technology is always last in major bull markets. For example. Microsoft hit new highs until a week before the stock market crash in 1987. So, don't be lulled into thinking that because new era stocks are surging (FB, AMZN, Biotech, Internet vapor stocks) that the market is fine. I'm not forecasting a melt-down or a crash at all... just a sideways to lower market for the next year or so to let the market grow into its valuation.
Until next time: Happy Trading
Tim 12:16PM EST, Thursday, September 26, 2013

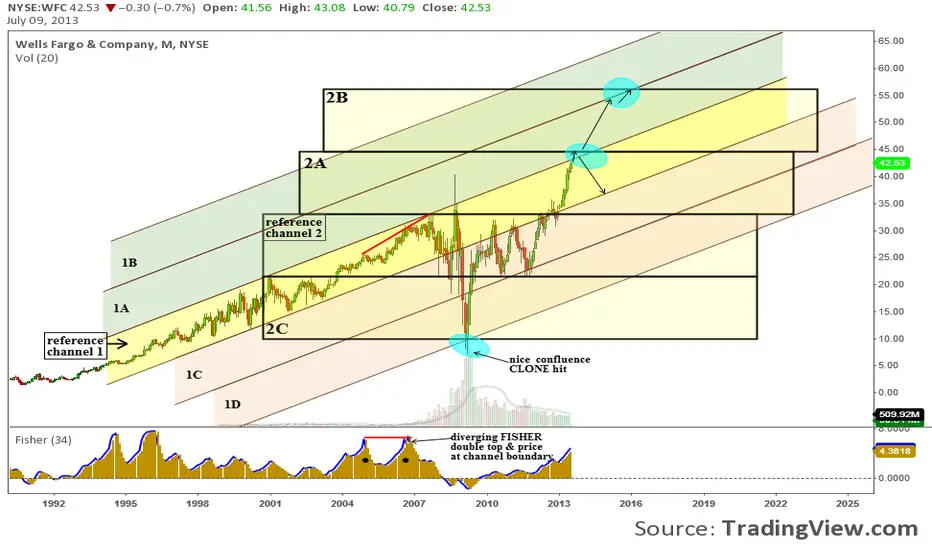
WFC monthly CLONE analysis Current candle stick price action is bullish. Fisher is in the high end range but still rising with no divergence.If WFC can break reference channel 1 to the upside, the near term price target is top of CLONE 2A. If we get bearish candle stick action in the current CLONE confluence area WFC could correct down to bottom of reference channel 1. If WFC breaks CLONE confluence to the upside the longer term target is top of 1A CLONE and or top of 2B. You can use your favorite indicator(s) or method to further validate CLONE action.