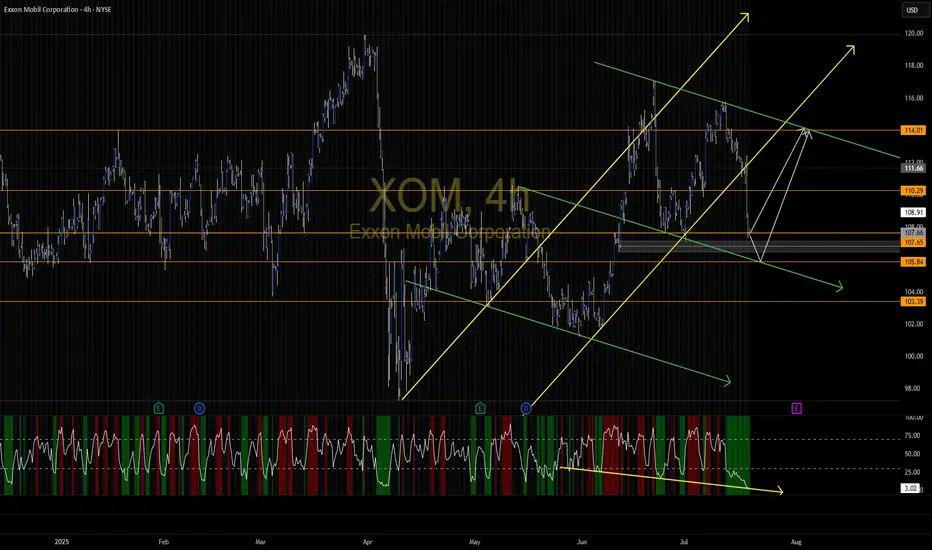
EXXON MOBIL Critical crossroads.Exxon Mobil (XOM) has been trading within a Channel Down since the June 17 2024 Low and just recently on the July 11 2025 High, it made a Lower High pattern similar to November 22 2024.
As long as the price trades below the 1D MA200 (orange trend-line), we expect to start the new Bearish Leg and te
725 ARS
30.84 T ARS
311.25 T ARS
About Exxon Mobil
Sector
Industry
CEO
Darren W. Woods
Website
Headquarters
Spring
Founded
1882
ISIN
ARDEUT110152
FIGI
BBG000DYN1T1
Exxon Mobil Corp engages in the exploration, development, and distribution of oil, gas, and petroleum products. It operates through the following segments: Upstream, Downstream and Chemical. The Upstream segment produces crude oil and natural gas. The Downstream segment manufactures and trades petroleum products. The Chemical segment offers petrochemicals. The company was founded by John D. Rockefeller in 1882 and is headquartered in Irving, TX.
Related stocks

XOM Short (-33%)XOM is likely to Sharp decline from $112, aligning with its target within the FVG zone and the leg of the Crab pattern.

XOM the Structure I see along with the RSIPlay the levels with confirmation and retest. I hope this helps
XOM 125 PT Leader of its sector XLE and showing relative strength.
Technical analysis is consistent with pattern formation and breakout
Top-Down Analysis in Action – Live Trade: Where I Enter and WhyIn this video, I walk you through my full trading process – starting with a clean top-down analysis.
I begin on the daily chart to spot key market structure and levels, then zoom in to the 1-hour chart for confirmation, and finally execute my trade on the 5-minute chart.
You’ll see:
✔️ How I define

XOM daily setup to $117XOM gave us a 50% retracement on the daily (I use 24 hour chart since it includes after hours), swept a key level, and bouncing off bullish FVG.
We break and hold $110.94 and we're in business.
Targeting $117.05. I have July 18 $110 calls.

Exxon Mobil Corporation (XOM) – BUY IDEA📌 We’re watching a strong bullish structure in XOM. After a sharp open, price retraces to fill the GAP and respects the key Low zone 🟧, signaling institutional interest.
🟢 Entry aligns with downside liquidity sweep followed by bullish momentum. This trade has confluence between previous liquidity,

Energy giants surge: Top 5 stocks to watchJune 2025 was marked by heightened volatility across the global energy sector . Amid fluctuating oil prices, geopolitical uncertainty, and ongoing industry transformation, major oil and gas companies delivered mixed results. Let’s break down the key drivers behind the moves in Shell, TotalEnergies,

XOM - Bullish Trade ideaXOM Trade Idea... 🎯 Entry Plan:
Base Entry Zone (accumulation):
ENTRY OPTION 1: $110.60–$111.50 → Retest 12-moving average
ENTRY OPTION 2 momentum trigger: Bullish reversal candle on 2H or 1H + reclaim of $113.00 (this means let price break above $113 after you get a fresh inverse Arc or Level 3

Quick View: $XOM
EMA21 crossed above EMA50 and pulled back.
Watching for a #TopSwing Setup
Area of $111as key resistance.
Support → $103 and $100

See all ideas
Summarizing what the indicators are suggesting.
Oscillators
Neutral
SellBuy
Strong sellStrong buy
Strong sellSellNeutralBuyStrong buy
Oscillators
Neutral
SellBuy
Strong sellStrong buy
Strong sellSellNeutralBuyStrong buy
Summary
Neutral
SellBuy
Strong sellStrong buy
Strong sellSellNeutralBuyStrong buy
Summary
Neutral
SellBuy
Strong sellStrong buy
Strong sellSellNeutralBuyStrong buy
Summary
Neutral
SellBuy
Strong sellStrong buy
Strong sellSellNeutralBuyStrong buy
Moving Averages
Neutral
SellBuy
Strong sellStrong buy
Strong sellSellNeutralBuyStrong buy
Moving Averages
Neutral
SellBuy
Strong sellStrong buy
Strong sellSellNeutralBuyStrong buy
Displays a symbol's price movements over previous years to identify recurring trends.
Curated watchlists where XOM is featured.

Big Oil: Integrated energy companies
10 No. of Symbols

Oil stocks: Liquid black gold
6 No. of Symbols

See all sparks