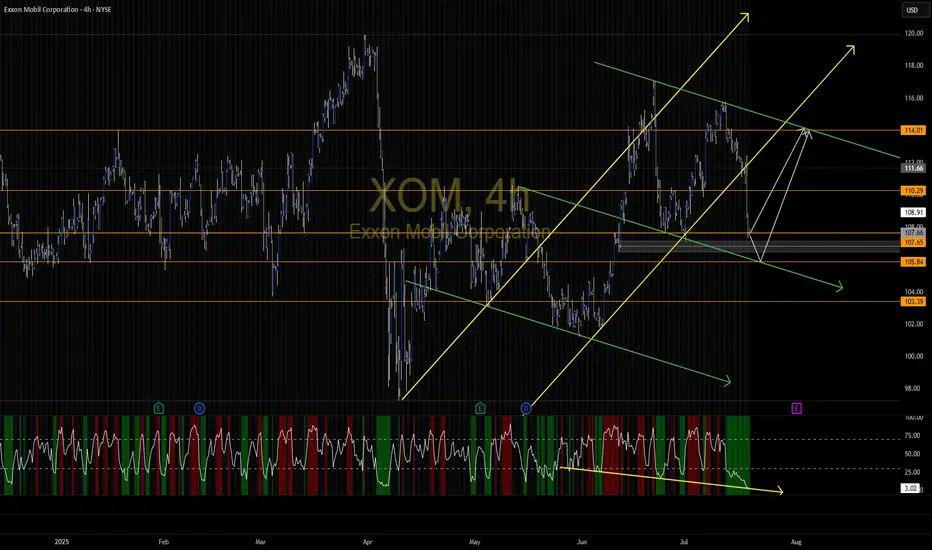
EXXON MOBIL Critical crossroads.Exxon Mobil (XOM) has been trading within a Channel Down since the June 17 2024 Low and just recently on the July 11 2025 High, it made a Lower High pattern similar to November 22 2024.
As long as the price trades below the 1D MA200 (orange trend-line), we expect to start the new Bearish Leg and test at least Support 1 (97.85).
If however it breaks above the 1D MA200 it will invalidate all prior Lower High patterns, and will most likely follow the (blue) Channel Up to break above the Channel Down. In that case, we will be targeting Resistance 1 (120.00).
-------------------------------------------------------------------------------
** Please LIKE 👍, FOLLOW ✅, SHARE 🙌 and COMMENT ✍ if you enjoy this idea! Also share your ideas and charts in the comments section below! This is best way to keep it relevant, support us, keep the content here free and allow the idea to reach as many people as possible. **
-------------------------------------------------------------------------------
💸💸💸💸💸💸
👇 👇 👇 👇 👇 👇
XOMD trade ideas

XOM the Structure I see along with the RSIPlay the levels with confirmation and retest. I hope this helps
XOM 125 PT Leader of its sector XLE and showing relative strength.
Technical analysis is consistent with pattern formation and breakout
Top-Down Analysis in Action – Live Trade: Where I Enter and WhyIn this video, I walk you through my full trading process – starting with a clean top-down analysis.
I begin on the daily chart to spot key market structure and levels, then zoom in to the 1-hour chart for confirmation, and finally execute my trade on the 5-minute chart.
You’ll see:
✔️ How I define my zones and structure
✔️ Why I wait for confluence across timeframes
✔️ Exactly where and why I enter the trade
Just real analysis and real trades.
If you’re looking to improve your entries and learn how to align multiple timeframes, this one’s for you.
🔔 Don’t forget to like, comment & subscribe for more real-time trading content!
NASDAQ:AMZN
NYSE:ANET
NASDAQ:CSCO
NASDAQ:CZR
NASDAQ:GOOG
NYSE:IONQ
NASDAQ:MRVL
NASDAQ:MSFT
NASDAQ:MU
NYSE:NKE
NASDAQ:NVDA
NASDAQ:ON
NASDAQ:SBUX
NASDAQ:SHOP
NASDAQ:SMCI
NYSE:TSM
NYSE:XOM

XOM daily setup to $117XOM gave us a 50% retracement on the daily (I use 24 hour chart since it includes after hours), swept a key level, and bouncing off bullish FVG.
We break and hold $110.94 and we're in business.
Targeting $117.05. I have July 18 $110 calls.

Exxon Mobil Corporation (XOM) – BUY IDEA📌 We’re watching a strong bullish structure in XOM. After a sharp open, price retraces to fill the GAP and respects the key Low zone 🟧, signaling institutional interest.
🟢 Entry aligns with downside liquidity sweep followed by bullish momentum. This trade has confluence between previous liquidity, the gap, and a continuation pattern.
🎯 Target: resistance area marked as High around $115+
🛑 Stop loss: placed just below the mitigation zone in case of invalidation.
⏱️ Timeframe: 15 minutes
🔍 Confirmations: institutional impulse + GAP + bullish momentum
💡 Following market strength and institutional logic.
#Trading #ExxonMobil #XOM #Stocks #WallStreet #TechnicalAnalysis #SmartMoney #OrderBlock #GapTrading #Momentum #SwingTrade #LiquidityZones #BullishSetup #PriceAction #ChartAnalysis #TradeSetup #Equities #EnergySector #GapFill #InstitutionalTrading

Energy giants surge: Top 5 stocks to watchJune 2025 was marked by heightened volatility across the global energy sector . Amid fluctuating oil prices, geopolitical uncertainty, and ongoing industry transformation, major oil and gas companies delivered mixed results. Let’s break down the key drivers behind the moves in Shell, TotalEnergies, BP, Chevron, and Exxon Mobil.
Here are the five leaders that set the tone this June :
1. Shell: Steady growth driven by strategic adjustments . The stock climbed 7% thanks to a pragmatic dividend policy and a $3.5B share buyback plan. LNG Canada project developments also boosted investor confidence.
2. TotalEnergies: Strong performance backed by green energy push . Shares rose 5.5% after the acquisition of a renewable energy portfolio and a dividend increase. Conservative production forecast (+3% for 2025) and investment in clean energy kept demand strong.
3. BP: Recovery supported by oil price rebound . BP added around 7% on oil market stabilization and a new share buyback program. Although production declined due to asset sales, higher profitability in the oil segment offset the drop.
4. Chevron: Notable gains fueled by new projects . Chevron advanced 7.5% following the launch of the Ballymore field in the Gulf of Mexico. Expanded buyback and dividend plans further attracted investors.
5. Exxon Mobil : Stable upward momentum from production expansion. Shares jumped nearly 10% as Q1 profits reached $7.7B. Liquefied natural gas development and output growth targets energized traders.
FreshForex analysts believe the rally in energy majors may continue in the near term. Shell, TotalEnergies, BP, Chevron, and Exxon Mobil remain strong picks for active investors.

XOM - Bullish Trade ideaXOM Trade Idea... 🎯 Entry Plan:
Base Entry Zone (accumulation):
ENTRY OPTION 1: $110.60–$111.50 → Retest 12-moving average
ENTRY OPTION 2 momentum trigger: Bullish reversal candle on 2H or 1H + reclaim of $113.00 (this means let price break above $113 after you get a fresh inverse Arc or Level 3)
You will be looking for a break above $113.00–$113.50 with strong volume = direct continuation entry
🛡 Stop Loss:
Hard stop: $109.63
🏁 Take Profit Levels:
TP1: $113.63 → Near-term ceiling
TP2: $114.98
TP3: $116.64 → 2x ATR
TP4: $118.90 →
TP5 (macro): $123.41 → $135.41 → Swing level only for Aug expiry holders. "These levels can be hit if the war causes an oil shortage or oil prices to remain elevated"

Quick View: $XOM
EMA21 crossed above EMA50 and pulled back.
Watching for a #TopSwing Setup
Area of $111as key resistance.
Support → $103 and $100

XOM - Bearish in 4 months more DOWNTREND
The price of XOM has gone too far with the MA200. It will have to return to the MA200 as soon as possible if it does not want to crash.
Let's take a look at its price on the WEEK frame. MA50 and MACD support bearish.
On the DAY frame, the volume decreased, the price movement was low, the candles were very weak. The possibility of continuing the downtrend is very high.
Price target up: $105.94.
Price now: $104.56 (11:15 AM, 04.16.25).
Price target down: $98.00/ $91.84.
The price history will repeat itself as in Q4 2023.
IMO amateur trader.

Oil Prices Rise on Middle East Tensions, Exxon Mobil Corp. SurgeExxon Mobil Corporation (NYSE: NYSE:XOM ) closed at $103.14 on April 11, gaining 3.21% in a single session. The rise comes as oil prices surge, driven by renewed tensions in the Middle East. Ongoing friction between Israel and Iran has heightened concerns over potential supply disruptions. These developments continue to shape investor sentiment across the energy sector.
Historically, geopolitical conflict in oil-producing regions leads to sharp price movements. Market participants often react to perceived threats of supply shortages. These reactions can result in immediate price swings, reflecting uncertainty in global energy markets. Current events have triggered such a reaction, pushing oil prices upward and benefitting energy stocks like Exxon Mobil.
XOM is also preparing for its upcoming earnings report, set for May 2, 2025. Watch closely, especially with the backdrop of global instability. Increased demand for energy assets may play a role in Exxon’s short-term performance.
Technical Analysis
Exxon Mobil recently rebounded from a key support zone at around $98. Price surged from this demand area and is now trading slightly below the 200-day moving average at $111.62.
A strong rally could follow if price holds above the current support. Immediate resistance lies near $120. If broken, the next major target sits at $126.34 previous high. However, a break below the $98 support zone could lead to a deeper decline. The volume surge also confirms increased buying activity, reinforcing the possibility of a continued uptrend in the coming days. Monitor price behavior near $110 for directional clues.

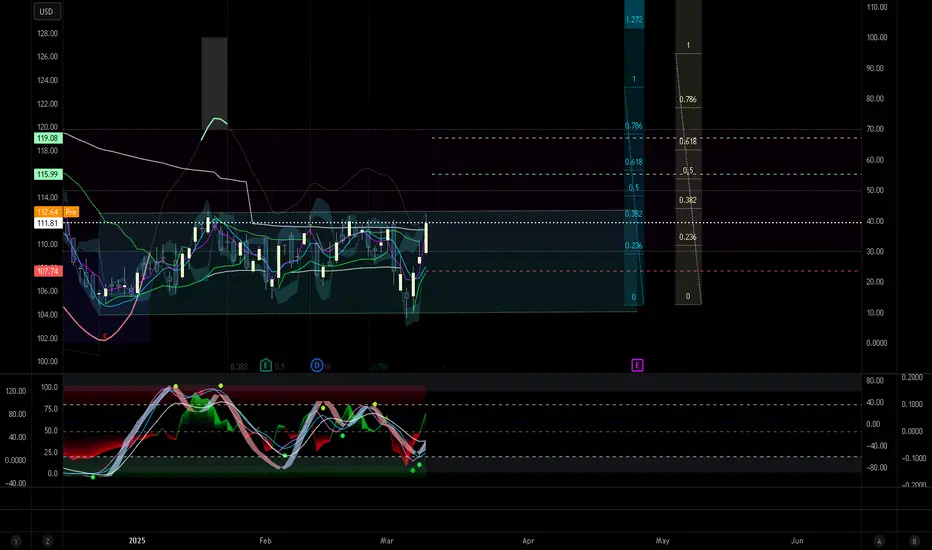
XOM Analysis: Oil's Next Move & Policy ShiftsNYSE:XOM currently piques my interest, particularly with oil prices potentially stabilizing or rising further. Recent geopolitical developments and policy shifts under Trump’s administration—such as rolling back Biden-era energy regulations, reducing methane fees, and easing LNG export permits—could significantly influence the energy landscape.
My intuition suggests Trump’s "Mar-a-Lago Accord" might involve major global economies reducing holdings of US dollar assets, swapping short-term treasuries for century bonds. Such currency shifts and reduced drilling activity could lead to a tighter oil supply, benefiting prices. Additionally, a weakening US dollar could positively impact technology stocks, as investors rotate towards sectors less affected by traditional commodities.
Technical Analysis (Daily & Hourly Chart)
Current Price: Approximately $103.00
Key Resistance Levels:
Immediate resistance: $103.93 (L.Vol ST 1b)
Important resistance zone: $104.74 (118 AVWAP)
Critical resistance (Last week's high): ~$106.46
Key Support Levels:
Near-term support: $101.13 (Weeks Low Long)
Major support: $97.92 (Best Price Short)
Trading Scenarios
Bullish Scenario (Continued oil strength & supportive policy shifts):
Entry Trigger: Sustained breakout and close above immediate resistance at $103.93.
Profit Targets:
Target 1: $104.74 (AVWAP resistance)
Target 2: $106.46 (recent swing high)
Stop Loss: Below recent pivot around $101.00, limiting risk effectively.
Bearish Scenario (Oil price weakness or production surge):
Entry Trigger: Failure to sustain the above resistance at $103.93 or a breakdown below near-term support at $101.13.
Profit Targets:
Target 1: $99.00 (psychological & short-term support)
Target 2: $97.92 (strong support, ideal short target)
Stop Loss: Above $104.75 to control risk in case of a reversal.
Thought Process & Final Thoughts
Given the current geopolitical and regulatory environment, XOM appears poised for potential upside if oil prices remain strong and policy shifts materialize. However, caution is warranted, as oil companies seem hesitant to increase production due to profitability concerns. Clearly defined technical levels will help navigate trade entries and exits effectively around these evolving macroeconomic conditions.
Earnings Date: May 2nd—Keep positions nimble as earnings can significantly impact short-term volatility.

EXXON FORECAST Q2 FY25My targets are clear anyways...
Exxon Mobil's stock performance is closely tied to global oil prices, which are influenced by various geopolitical events and policy decisions. Recent developments involving President Trump's administration and OPEC have introduced factors that could exert downward pressure on Exxon Mobil's share price.
President Trump's Influence on Oil Prices
President Trump has advocated for increased oil production to lower global oil prices, aiming to impact oil-rich nations' revenues and address geopolitical concerns. He has urged OPEC to reduce prices to affect Russia's finances and expedite the end of the war in Ukraine. Such calls can lead to increased production or reduced coordination among oil-producing countries, potentially resulting in an oversupply and subsequent price drops.
Business News Today
OPEC's Production Decisions
OPEC's recent decisions to adjust production levels have significant implications for the oil market. For instance, increasing the production ceiling can lead to higher supply, which, if not matched by demand, may cause oil prices to fall. Historically, such actions have led to declines in Exxon Mobil's stock price, reflecting the company's sensitivity to oil price fluctuations.
The Street
Market Reactions and Investor Sentiment
The interplay between U.S. policies and OPEC's actions creates uncertainty in the oil market. Investors may react to potential oversupply concerns and geopolitical tensions by adjusting their positions in energy stocks like Exxon Mobil. For example, the anticipation of increased U.S. crude output and changes in sanctions enforcement can influence market dynamics, affecting stock valuations.
S&P Global
Given these factors, it's plausible that Exxon Mobil's share price could experience downward pressure due to the combined effects of increased production, potential oversupply, and geopolitical uncertainties stemming from recent events involving President Trump and OPEC.

XOM Coiling Under Resistance: Gamma Breakout or Rejection Setup?1. Market Structure Analysis: XOM has formed a balanced range after printing a Break of Structure (BOS) and two notable CHoCHs on the 1H timeframe. Price is consolidating inside a green supply zone between 118.50–119.90, with wicks tapping the top of the zone but no clean breakout yet. The price structure is forming higher lows from the March 28th pivot, signaling accumulation beneath key resistance.
2. Supply and Demand Zones:
* Demand Zone (Support): 117.21 → Strong historical zone and prior low from BOS candle.
* Supply Zone (Resistance): 119.00 – 119.90 → Flat ceiling that's held since March 26.
3. Order Blocks and Support/Resistance:
* Resistance: 119.90 (key gamma wall + SMC zone)
* Support: 117.21 (red BOS support and trendline base)
* Trendline: An ascending support trendline from March 28th low is intact. Watching for a triangle breakout or breakdown.
4. Key Indicators (MACD, Stoch RSI):
* MACD shows a bullish crossover with histogram building strength.
* Stoch RSI is rising out of oversold territory and nearing mid-zone. Still room to run before hitting exhaustion.
These indicators currently support momentum building toward a bullish breakout.
5. Options Flow / GEX Sentiment Zones:
* Highest positive GEX: 120.00 → Gamma resistance and breakout target.
* Call Walls: 119.00 (74.31%), 121.00 (moderate), 124.00 (light).
* Put Walls / Downside GEX: 116.00 is the HVL + strong negative gamma level, 115.00 and 113.00 are next layers of support.
Options Oscillator:
* IVR: 29.1
* IVx avg: 24.2
* Put$ Flow: 24.3%
* GEX Bias: Strongly bullish with green bars stacked to 124
This setup supports a potential gamma squeeze if price pushes above 120 with strength.
6. Scalping vs Swing Outlook:
* Scalp Bullish Trigger: Break and hold above 119.90 = breakout play to 121.00.
* Scalp Bearish Trigger: Rejection at 119.90 = short setup back to 118.30–117.90.
* Swing Bullish Setup: Entry on retest of 118.50 with SL below 117.20 and PT at 121.00 → 124.00
* Swing Bearish Setup: Only valid if clean break below 117.20 with volume, targeting 116 → 113.
7. Actionable Suggestion: If XOM opens above 119.50 and breaks 119.90 with increasing volume and flow, look for a momentum breakout toward 121 and 124. If the move stalls under 119.90 again, consider fading the resistance for a pullback play.
8. Conclusion: XOM is coiled for a potential breakout, sitting just below a major resistance cluster at 119.90. Gamma levels and bullish options flow favor an upside push, but failure to break could trigger mean-reversion. Watch for volume and reaction at the 120 level.
9. Disclaimer: This analysis is for educational purposes only and does not constitute financial advice. Always do your own research and trade responsibly.

EXXON MOBIL: This strong rally won't end any time soon.Exxon Mobil is about to turn overbought on its 1D technical outlook (RSI = 67.390, MACD = 2.260, ADX = 52.087) as for the 4th straigh week it is posting gains. This rally started on the first week of March when the stock almost touched the bottom of the 2 year Channel Up. This is a similar bullish wave to the one that started after the January 2024 bottom, which eventually reached the 1.236 Fibonacci extension. Aim for a bit under the top of the Channel Up (TP = 128.00.
See how our prior idea has worked out:
## If you like our free content follow our profile to get more daily ideas. ##
## Comments and likes are greatly appreciated. ##

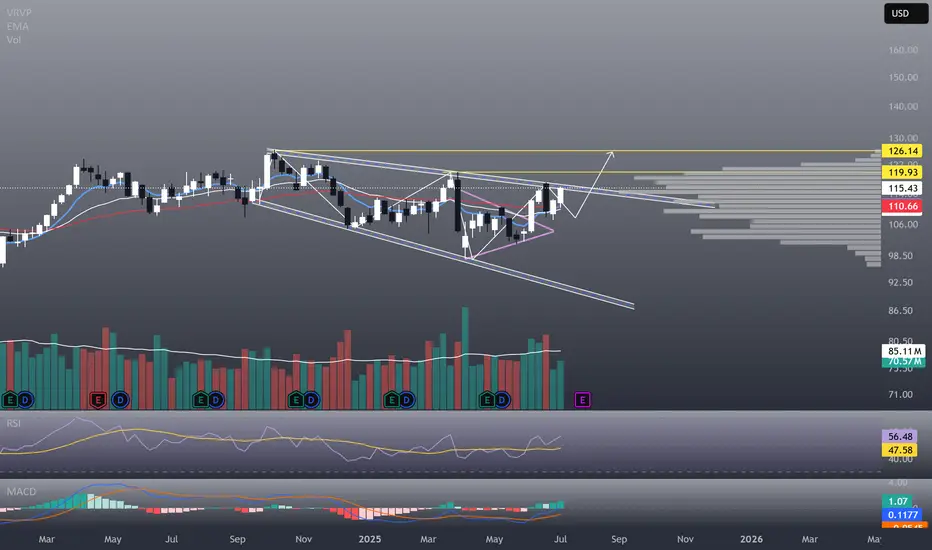
ExxonMobil: Toward the ResistanceExxonMobil: Toward the Resistance
As planned, XOM recently continued to rise with the magenta wave . We give this movement a bit more room, but another smaller corrective movement of wave should start below the resistance line at $126.34 before XOM ultimately surpasses this mark. Once the upward movement stalls below $126.34, it is important that the price doesn't fall too deeply afterward. After all, there is a 40% probability for our alternative scenario, where not wave in magenta but wave alt.2 in turquoise would develop its high – confirming an already established top of the overarching wave alt.(B) and, thus, a generally corrective scenario.

XOM - Good Shot to Hit 150Reverse Head and Shoulders seems to have building out for some time. The Major Right shoulder appears to be completing the head of yet another reverse head and shoulders pattern. When this formation resolves, no reason that XOM can't easily pass 150.
My gut is telling me that the inflation is going to get really ugly. Can't imagine that oil prices won't keep pace. With their acquisition of Pioneer not long ago, they will prove to be the kinds of the Permian Basin. Drill baby drill.

XOM to Double!Could be completing a Wave 2 correction formation. Appears to be a Reverse Head and Shoulders with a neckline just above 120. If, in fact, we are beginning a 3rd Wave, a 1.618 of Wave 1 move would put XOM at 240.

Ascending wedge Being as new as I am to technical analysis, it is always great to find a trend without overlooking it. Watch how price reacts around then$110 area. We are looking for a small pull back and then from there to go up to around the $113 area where out next target area is.

Nice Support And Resistance But fill the GAP!After the jump up to $110 where we have strong resistance and we have for awhile. this seems to be the sweet spot. It did go up to $112 in Pre market but at open it quickly shot down. $108 seems to be a strong support level. Im really hoping this is the play in which we are able to fill this gap. After the gap fill then we can really focus on the support and resistance and hopefully touch $112 and stay there. Safe Trading, I watch this stock like a hawk so im sure I will be updating this all the time.

Exit Tight Trading Range on Exxon. XOMTight trading ranges are always tough, as they cause indicators to constantly throw off false signals. There is no way to know which signals will be false. Taking a chance on this one nonetheless. Three soldier candlestick pattern that breaks MIDAS curve and crossings on VZO+offset and Ehlers StochRSI. BB%PCT also crossed zero line. vWAP/US duo in alignment and supportive. It is uncommon to see all the stars lineup like that.
ExxonMobil: Final Pullback ExpectedExxonMobil should soon resolve the ongoing sideways phase, allowing the turquoise wave 2 to establish its corrective low below $104.84. This final pullback is still needed before the next impulsive rally unfolds. Alternatively, there is a 32% chance that the key low was already settled by the turquoise wave alt. 2. A break above $123.74 would confirm this scenario.

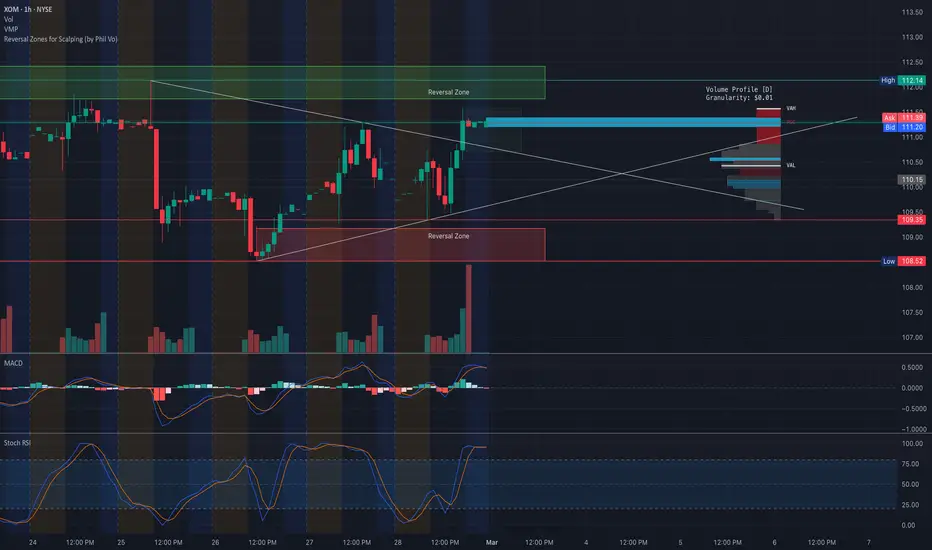
XOM at a Pivotal Zone! Will Bulls Take Control?Technical Analysis (TA) Overview:
📌 Price Action: XOM is testing a key reversal zone, showing strong buying pressure after breaking out from a descending trendline. The price is now consolidating near resistance.
📌 Support & Resistance:
Resistance Levels: $112.87 (Major Resistance), $115 (Call Wall)
Support Levels: $109 (High Volume Node), $108 (Put Wall)
📌 Indicators:
MACD: Bullish momentum building, but still in a weak positive zone.
Stoch RSI: Overbought levels (95+), suggesting a potential short-term pullback before continuation.
📌 Volume Profile:
High liquidity around $111-$112, indicating a potential battle between buyers and sellers.
GEX (Options Analysis) - Key Insights:
📌 Gamma Exposure (GEX): Positive GEX at higher levels suggests dealers may hedge by selling, acting as resistance.
📌 Call Walls (Resistance Levels):
$112-$115 (Highest positive GEX zone) → Likely resistance, where price action might slow down.
$120 (Extreme Call Wall) → If momentum sustains, this could be a long-term target.
📌 Put Support Levels:
$109-$108 → Strong support, if broken, could trigger a sell-off to $105 (next put support).
📌 Options Sentiment:
IV Rank (IVR): 32.7 → Moderate implied volatility, options not overly expensive.
Calls 11.3% → Mild bullish positioning in the options market.
Potential Trade Setups:
✅ Bullish Scenario: If XOM holds above $111, a breakout toward $115+ is possible.
❌ Bearish Scenario: Failure to hold $109 could send XOM back to $105-$106.
💡 Suggestion: Watch for a retest of $109 as support before a breakout move!
📌 Final Thoughts:
Short-term traders: Look for confirmation above $111 for a quick move to $115.
Swing traders: Ideal entry on a pullback to $109-$110, targeting $115+.
Options traders: A breakout over $112 with rising call positioning could fuel momentum.
📢 This analysis is for educational purposes only and does not constitute financial advice. Always do your own research before making trading decisions! 🚀