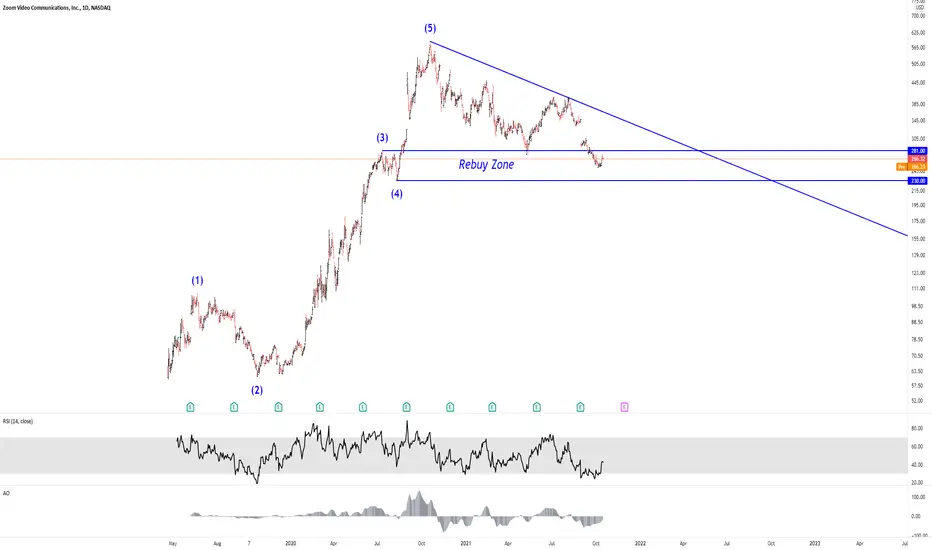
Getting Rekt At Home.Been a very nice 5 wave move up and a long correction so far, This looks to be quite the buying opportunity as a guess considering where we are sitting, Working from home is a structural shift and a lot more people will not be going back to offices.
ZMD trade ideas
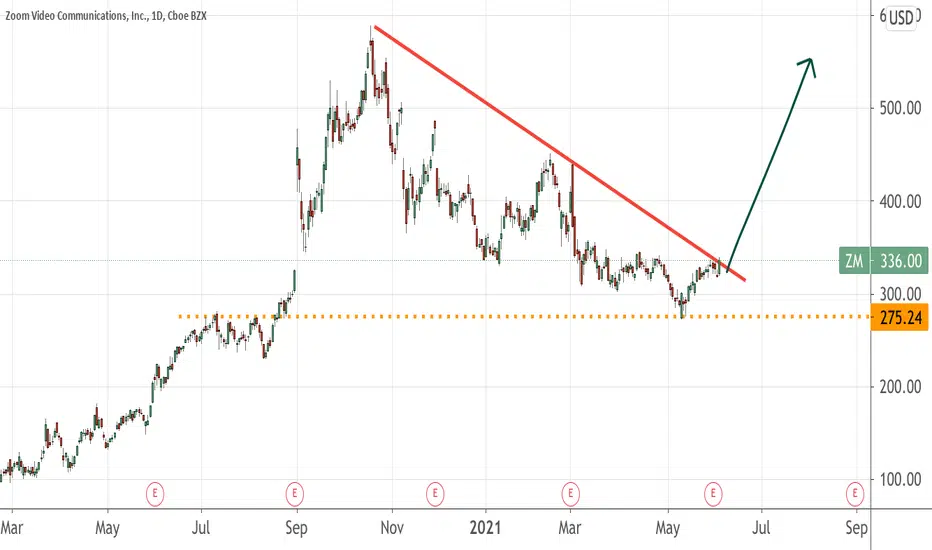
Zoom Company, nice deep to buyas you can see after a good correction it seems to be nice enrty as per this figure.


$ZM Zoom Video Price Targets if 21ema Breaks
Hopefully you find the chart helpful in terms of Supports & Resistance etc.
we refrain from adding commentary on the chart as that is reserved for our members and we are very conscious of not giving financial or trading advice.
Thank you for taking time to consult our chart and we would really appreciate a like, follow or comment.


ZM short potential, but not a good RR ratioZM has shorting potential, however, the risk reward ration is abysmal so we will stay out of this potential trade.

$ZM short position Idea!-Swing Still active on we are moving slowly but surely the over all ideal is to reach $230 of you have not entered in this Swing you still have an opportunity
- New support formed at $250 once we break that point it is safe for an entry

HUGE BULLISH DIVERGENCE ON ZOOM!As you can see Tech has started to rally. Zoom seems to be the only one lagging but you can see a lot of accumulation going into a major demand zone From last years huge spike.
4HR Time fram shows Bulllish divergence into major demand Zone.
Patience Pays and I am 100% expecting a huge run from zoom going into the end of the month. Option IV is dirt cheap, this will be the next big play. I trade the naked chart just using supply and demand zones.
2 years if experience in the market. I believe tops and bottom are shown by divergences. Not Rand candles and Elliot/Fibs counts


Zoom (ZM) - Currently At Interesting Long EntryI am expecting a bounce from this range (possibly short term). Just sharing my trading plan, not meant as advice.

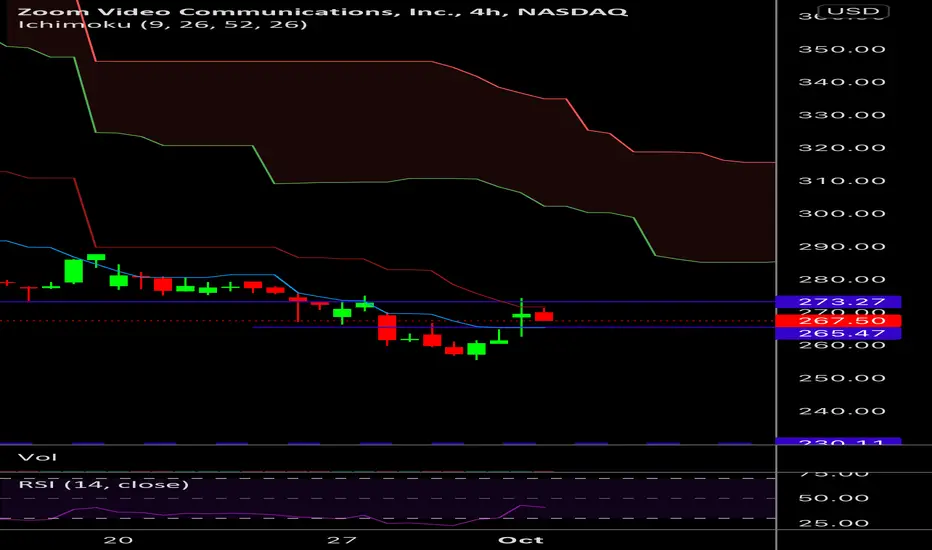
ZM PUTS!!!! As we can see price is bouncing heavily off the 9-day moving average so we have some strong resistance there. Second the next support we have is gonna be at 265.50 so we should be looking for an entry around that range again our PT is all the way down to $235

AB = CDAnd it does equal for now. But CD can be an extension of the AB leg which would take price lower.
IvanHoe, Lancelot and William Tell, Do they envy me? Probably not
Worth watching though..LOL
Possible stop under last leg down Perhaps/well for sure/Look for a bottom consolidation before entering or a retest of the low
No recommendation//iffy/just watching
Until the 20/blue/ turns up I am just keeping an eye on this. Before i enter a bottom I like to see this SMA doing something magnificent (o:


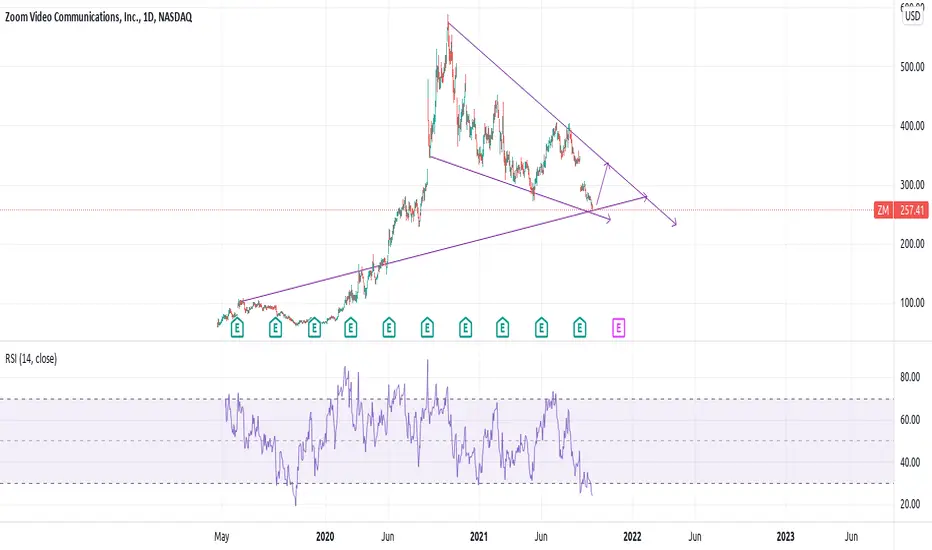
Zoom to Drop to $230The wave analysis shows it could be doing a Wave C down. which will take its price down to 230.

ZM- Falling Wedge- Make or BreakZM- just broke below aVWAP from IPO- things are going to get unruly here if it can't break above the resistance of the wedge- I'd previously thought 265 would be sufficient, and while encouraging for bulls, I think we need 268 for even more conviction at this point. Breakdown out of this pattern and a complete freefall ensues- 252- 250-- 242. This is going to give us an explosive move either way, and I refuse to take my eyes off it.

zm ideazm is right at two trendlines, with rsi way oversold, if this thing gaps or lsoes this support, it could be very bad, i bought calls at ~261 slightly down today but fk it.
Zoom Video Communications IncWednesday, 29 September 2021
23:19 PM (WIB)
Zoom keep falling after created double top, and has been tested all around of Fibonacci. From 0 F to 0.786 F. One thing that yet is 1 F or $230. I thing this falling downtrend directing to this point as strong support. After reach the lowest support, the price should move upside into key level resistance at 0.5 F or $400. Keep watch and notes.
Best regards,
RyodaBrainless
"Live to Ride and Ride to Live"

ZM (update)Now that we have gotten to the (Green zone) their is only (2) scenarios to look at. We are what looks like are at the "Ending" of the last part of the "5th wave minuette" of the "(3rd wave or (C wave) " which what looks like an "Ending pattern" . So now the only possibilities is that either this is an (ABC) to enter a (WXYXZ pattern) which is #1 scenario, and #2 scenario which is the "5 wave down" and knowing we have a deep "Wave 2" this " Wave 4" will be towards the following zones for a (Shallow retrace). Now the only way to know if this isnt the "5 waves down" and is the (WXYXZ pattern) is to have it break the zones and break the (.618 fibonacci Algo zone) which will lead to further upside before continued down fall.For #1 i have put zones and targets zones. As always these are my opinions.
As always happy trading : )

XM oversold Ready for $300$ZM Now at a VWAP from IPO day. These levels have great significance and can't be lost easily and acts as good support. This is a pretty good place to add and ride it up.
Target-1 $290
Target-2 $330 (Gap FILL)

Zm stockGetting obersold on the daily getting some calls for this one. Crude scalp on the 1hr says buy
