BCH/BTC 12H (Binance) Descending channel breakoutTA: Bitcoin Cash looks bullish again after breaking that parallel channel resistance. I will operate it on Spot and Margin (up to 5x).
FA: Hashrate droped after his halving more than a month ago, but now Bitcoin halved, hash power is back on BCH.
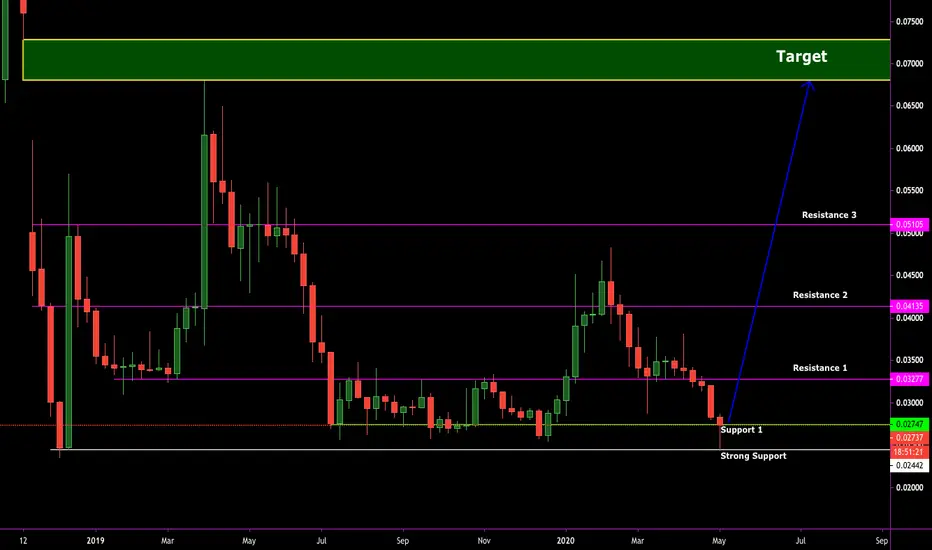
Current Price= 0.025541
Buy Entry= 0.025607 - 0.025067
Take Profit= 0.027767 | 0.029748 | 0.032951
Stop Loss= 0.022907
Risk/Reward= 1:1 | 1:1.82 | 1:3.13
Expected Profit= 9.59% | 17.41% | 30.05%
Possible Loss= -9.59%
Fib. Retracement= 0.236 | 0.382 | 0.618
Margin Leverage= 1x | 3x | 5x
Estimated Gain-time= 360h
BCHBTC trade ideas

BCH-BTC HUGE Move Coming .. To me, theres only 1 way to go - UP!Reference the chart to see the 2-day historical volatility index squeezing quite hard here at a major support. We are either about to see a BIG move up or a BIG break of support into a move further down.
Personally, I like to judge the incoming direction based on current market drama.. crypto traders love to give reason for moves AFTER the fact.
While BTC fees are $25 a pop, transaction times increasing, and miner capitulation upon us - this serves BCH very well. For now, in a battle between BTC and BCH, I will err on the side of Bitcoin Cash.
Especially while the price sits on major support, it seems foolish to bet on a break. The better risk/reward play is long.
Good luck on whichever side you pick and happy trading!


BCH/BTCBCH has reclaimed successfully the range low, which also is the key S/R, and broken the downtrend line. With altcoins pumping across the board, I expect a massive gain from BCH here.
Long it !!
Note: If you like the content and the setup, please give me a follow not to miss out on many altcoins charts to come.

Will Surprise You Bitcoin Cash? Not Us! (100%+ Possible)Will Bitcoin Cash (BCHBTC) surprise you?
Not anymore...
This altcoin trading pair will produce massive gains pretty soon.
Right now Bitcoin Cash (BCHBTC) is coming out of new All-Time Low after Bitcoin peaked.
As BCHBTC comes out of the low, when Bitcoin drops, it can make a strong jump.
We are looking at the 0.786 Fib. extension as the target in the least but Bitcoin Cash can go beyond and print 100%+.
This is not financial advice.
Namaste.
--
Bitcoin Cash 10X Lev. Trade For 280% Potential Profits


BTC $25 fee.. 1 hour confirmations.. BCH will shine! +150%You can buy the BTC pair, or you can buy USD pair. I would put my eggs in BCH-BTC though.
If Bitcoin sees a crash due to high fees and long confirmation times, BCH will really shine versus it.
Best case scenario is a Bitcoin Cash pump WITH Bitcoin... but either way, the chart's setting up well. MASSIVE multi-month pennant forming here with measured move to the mid .06 range.
Check back for updates and happy trading!

BCH/BTCFor all the fans of BCH, if there is somewhere the coin must bounce, it must be right here, which is actually the last support. With BTC cooling off and the halving hype has gone, I expect BCH to bounce heavily from here.
Its time for all BTC forks.....
Note: If you like the content and the setup, please give me a follow not to miss out on many altcoins charts to come.

Bitcoin Cash Found Support (Early Signals)Has Bitcoin Cash (BCHBTC) found support?
Right now we have a very steep descending channel in which BCHBTC remains... But this can easily change.
A strong bullish divergence can be spotted with the MACD, signaling that this trend is potentially coming to an end.
Trading volume is really low and BCHBTC recently hit a new low.
On top of the divergence with the MACD, there is also short-term bullish divergence with the RSI.
This setup is good to trade with a tight stop-loss at the last low... Very simple, low risk and high potential rewards.
This is not financial advice.
Namaste.


Bitcoin Cash Loading for +166% Why Please Read This with DetailBitcoin Cash Technical Analysis Update:
#BCHBTC now Current Price is 0.02730 as writing this Post.
Whats TA Says..?
According to TA I can say this is bottom of Bitcoin cash and now Strong holding at 0.02630 Support level.
and good bounce from support level.
so According to TA its give me Long Setup Entry for Me,
and I bought some BCH/BTC at CMP.
Support:-
According to my Chart BCH/BTC Bottom is 0.02430 BTC. and you also check Strong bounce back from that range in weekly chart.
after this bottom BCH/BTC went up to around 16% and now again Retracement Level.
So I am track each and every time for Good opportunity to buy.
0.02430 is 5 month Support Level.
After Weekly support we can also see in chart Support 1 also strongly hold.
and 1 day MACD very near to bullish Crossover.
Resistance:
in the chart I mentioned all Resistance .
so every resistance is our Target point.
0.03233 is our first Resistance level and also very important resistance level.
if we breakout this Resistance then we can see our next target and resistance.
So never gamble and red chart of my updates and follow carefully.
Stop Loss:
Guys I personally not Placing Stop loss for long term holding.
But my short term holding I placed stop loss at 0.02640 and 0.02600 is best stop loss for Short term scalping trader.
Targets:
As I mentioned in Chart my all Resistance is my Target point.
and if I am talking about Long term my Target is 166% and Why 166% because of Long term GAP at 0.07280 BTC still not filled so I am waiting for this GAP.
What Now..?
I think you this is Good Opportunity for fresh setup in BCH/BTC.
and I all think mentioned in this updates for short term and long term Trader.
so Trade Smart not Blindly.
I am Your Friend CryptoPatel and I need Your Huge Support.
If you Agree with My Technical Analysis then
Please Click #LIKE Button and Appreciate me with your Love.
And must Follow me for Latest crypto updates. ( Real Time Crypto updates.)
Thank you in Advance ( Love you guys)


BCH/BTC - it's time to buy or what?Simply put, an area of support is where the price of an asset tends to stop falling, and an area of resistance is where the price tends to stop rising. But traders really need more information about support and resistance beyond those simple definitions before they attempt to make trading decisions based on those areas in a chart.
To use support and resistance effectively, you first need to understand how asset prices typically move, so you can then interpret support and resistance from that framework. You also need to be aware that there are different types of support and resistance, such as minor and major/strong. Minor levels are expected to be broken, while strong levels are more likely to hold and cause the price to move in the other direction.


BCH/BTC - There is a possibility for the beginning of an uptrendThis is all my own opinion. Please take this information and do your own research.

BITCOIN CASH ($BCH) 14 MONTH LONG WYCKOFF ABOUT TO COMPLETEI never post on TV unless i'm 99% sure in the setup.
My first and only post on TV was the BTC 2018 bottom setup I was confident in, and it ended up taking path a) at the end.
Currently, I am looking at the BCH 14+ month long wyckoff accumulation pattern
Made me look at the giant wyckoff on D3 instead of the smaller one on H12. This one broke down on Nov 14, 2018 (BSV split) and is giving a hint that Roger Ver's and Bitmain's casino chips may end up being an EPIC win, while everyone is a) not looking b) loling and trolling
50-200 SMA golden cross is a few days or another 10% pump away from happening on the daily.
Strong buy for 2020, especially with the Bitcoin Cash halving 3 months before Bitcoin's.

BCH BTC daily chartHi everyone
BCH is under the ICHI cloud, 50 & 200 EMA to keep downward more. but faces with support areas that I expect to bounce upward.
so if you look for entry point, wait for the price to touch support levels, if it bounce its a good chance to follow my expected movement
upward. stay safe
Enjoy the market

BCH/BTC buy opportunity!BINANCE:BCHBTC
We can see BCH/BTC moving in falling wedge.
Possible buy zone is already here but may dip lower.
Till there is no close below the lower (yellow) falling wedge line the pattern is valid in my eyes.
enjoy!

BCHXBT - Failed rallies. Losing dominance.Failed rally in Feb. Failed rally after crypto dump in March. Failed rally after halving in April. Maybe it will try again from lower.

BCHBTC 1D death cross, fib, and support zones.BCH is just now working on its 1D death cross (200 EMA crossing above the 55 EMA). This fits nicely with BCH rising into a nice orderblock (blue box). We have a confluence of multiple resistances here - 618 fib, stacked 55/100/200 EMA , and daily volume profile PoC . Looking at RSI , we see a trend line that it is likely to test and stochs also looking like a bit of upside, which should see us moving up to these resistances. I will be layering shorts from PoC (~.0339) to 200 ema (~.0352). Target here is the next order box (.0265, 25% move). Will start phasing out of short if we get any 12h or 1d closes above this order box (~.0365), with a SL at .0388.
