BCHBTC trade ideas

BCH / BTC WedgeA wedge forms in a downtrend. Possible entry on a breakout or pullback after a breakout of its resistance.

BCH/BTC - Opportunity hunterPatience might be tested for another few weeks or even months. But the patient one will be rewarded.
The EMA ribbon is getting tighter and a trend shift is on the horizon.
This market looks bottomed out, what's your take on this market structure?

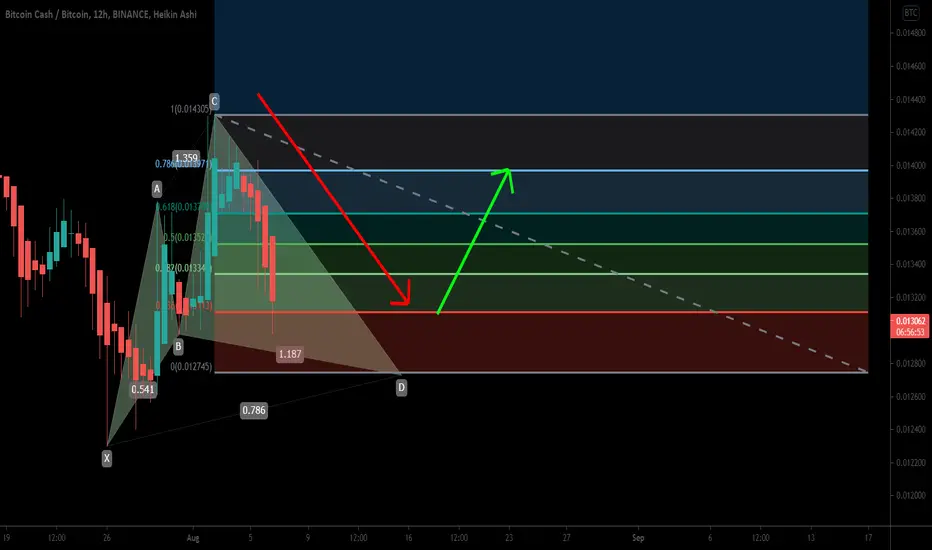
Bitcoin Cash (BCH) formed a bullish BAT for upto 18.5% moveHi, dear friends, hope you are well and welcome to the new trade setup of Bitcoin Cash (BCH) with Bitcoin pair.
On the 12-hourly time frame chart, the price action of BCH has formed a bullish Cypher .
Haters gonna hate, But BCH is ready to moon.This massive falling wedge broke, and has been retested. unlike prior times when it faked out, followed by massive carnage. This time It has maintained the line and now moved above again. I am expecting a Bitcoin bull run, now lets assume BTC is at 100k. BCH will be at 10k if .1 and 20k if .2
If we break all time highs vs BTC then were actually looking at BCH being 1/2 of bitcoins price.
Also of note - BCH typically trades HIGHER than ETHEREUM per coin.
BCH is massively undervalued.

BCHBTC Moving in the Bullish Channel
Welcome back Traders, Investors, and Community!
Hi Traders, BCHBTC on H4 is moving in the Bullish channel. The last green candle indicates that I can go higher from now
⬆️Buy now or Buy at 0.013323
⭕️SL @ 0.012505
✅TP1 @ 0.014470
✅TP2 @ 0.015230
✅TP3 @ 0.016080
We will have more FREE forecasts in TradingView soon
❤️ Your Support is really appreciated!❤️
Have a Profitable Day

💡Don't miss the great buy opportunity in BCHBTCTrading suggestion:
". There is a possibility of temporary retracement to the suggested support line (0.01371).
. if so, traders can set orders based on Price Action and expect to reach short-term targets."
Technical analysis:
. BCHBTC is in a range bound, and the beginning of an uptrend is expected.
. The price is above the 21-Day WEMA, which acts as a dynamic support.
. The RSI is at 63.
Take Profits:
TP1= @ 0.01447
TP2= @ 0.01523
TP3= @ 0.01608
TP4= @ 0.01810
TP5= @ 0.01961
SL= Break below S2
❤️ If you find this helpful and want more FREE forecasts in TradingView
. . . . . Please show your support back,
. . . . . . . . Hit the 👍 LIKE button,
. . . . . . . . . . Drop some feedback below in the comment!
❤️ Your support is very much 🙏 appreciated!❤️
💎 Want us to help you become a better Forex / Crypto trader?
Now, It's your turn!
Be sure to leave a comment; let us know how you see this opportunity and forecast.
Trade well, ❤️
ForecastCity English Support Team ❤️

💡Don't miss the great buy opportunity in BCHBTCTrading suggestion:
". There is a possibility of temporary retracement to the suggested support line (0.01371).
. if so, traders can set orders based on Price Action and expect to reach short-term targets."
Technical analysis:
. BCHBTC is in a range bound, and the beginning of an uptrend is expected.
. The price is above the 21-Day WEMA, which acts as a dynamic support.
. The RSI is at 62.
Take Profits:
TP1= @ 0.01447
TP2= @ 0.01523
TP3= @ 0.01608
TP4= @ 0.01810
TP5= @ 0.01961
SL= Break below S2
❤️ If you find this helpful and want more FREE forecasts in TradingView
. . . . . Please show your support back,
. . . . . . . . Hit the 👍 LIKE button,
. . . . . . . . . . Drop some feedback below in the comment!
❤️ Your support is very much 🙏 appreciated! ❤️
💎 Want us to help you become a better Forex / Crypto trader ?
Now, It's your turn !
Be sure to leave a comment; let us know how you see this opportunity and forecast.
Trade well, ❤️
ForecastCity English Support Team ❤️

How to use "Auto Trendline and Breakout Alert" IndicatorIn this tutorial, we will learn how to use the "Auto Trendline & Breakout Alert (Linear / Log)" indicator.
Note: You can find it in the scripts section of my profile
Auto Trendline & Breakout Alert(Linear / Log) Full-Version by BobRivera990
Overall Introduction
This indicator is the best tool for breakout traders.
Drawing and evaluating the trend lines of multiple charts in different time frames is a very time-consuming and tedious task. In addition, being aware of breakouts in the shortest possible time requires constant monitoring.
With this tool, you can draw and classify trend lines in a fraction of a second and by placing an alert on any chart, you can receive notifications about breakouts, wherever you are.
The classification of trend lines is done based on the reaction of the price chart to the trend lines and the analysis of the trading volume .
This indicator is designed to reclassify trend lines with each reaction of the price chart. These lines are classified into 6 levels and these levels are distinguished by different colors. Thus, any touching or crossing of the price chart can make a difference.
Features
This indicator is designed for use on both linear and logarithmic scales. It works linearly by default. If you are using a logarithmic chart, enter the settings menu and set the chart scale parameter to “Log”.
The indicator is equipped with the volume status tool to identify and avoid false breakouts. Note that you can't completely avoid false breakouts, but you can minimize risk and loss. I have already published volume status as a separate script.
Several filters are provided to customize alerts. You can limit alerts based on the level and strength of broken trend lines , volume status, and type of breakout (Cross-Over, Cross-Under, or both).
The last breakouts panel gives an overview of the current market situation. You can activate it in the settings menu. the figure below shows the panel:
How to setup
There are many parameters in the settings menu, but two are more important. One is “Chart Scale” and the other is the “Max Operational Range Length".
Set the “chart scale” parameter according to the chart, otherwise the trend lines drawn by the indicator do not match the price chart.
If you are using a linear chart, select the "Linear" option or if you are using a logarithmic chart, select the "Log" option.
Max Operational Range Length Limits the range of the price chart that is processed by the indicator.
By increasing this parameter:
The strength and durability of the trend lines increases.
The number of breakout signals decreases.
The importance of breakout signals increases.
The indicator processing load increases.
The best range for "Max Operational Range" is from 300 to 1200,Change it until you get the best view possible.
Also by changing the "Filter" parameter from 1X to 5X, you can reduce the clutter in the chart.
The following figure shows the results of correct and incorrect settings:
Use it well...

BCH/BTC buy opportunityHi followers,
BINANCE:BCHBTC Formed higher low after big ABC drop,
Now with the break up of the Flag pattern , we maybe ready for another impulsive move up.
Don't forget to manage your risk! 👌
Good luck and trade with care 🙏
If you like my ideas - 👍 Like, 👆 follow and 👉 share!
❗❗❗
Disclaimer: This information is not a recommendation to BUY or SELL. It is to be used for educational purposes only!

The Crypto Cross BCHXBT in Upward Trend Channel on 2 Hour ChartDisclaimer
The views expressed are mine and do not represent the views of my employers and business partners. Persons acting on these recommendations are doing so at their own risk. These recommendations are not a solicitation to buy or to sell but are for purely discussion purposes.
Trend Analysis
The main view of this trade idea is on the 2-Hour chart. BCH/XBT had a low in late June 2021 at 0.01331. The crypto cross proceed to form an upward trend channel with what appears to be several support/resistance zones in the trend channel. The most prominent support/resistance zone is the 0.1472-0.1505 price region. Traders can anticipate some possible market entry at that support/resistance zone which is a bit below the middle of the upward trend channel. A resistance zone is perceived in the 0.154-0.156 price level, which is near the upper region of the upward trend channel. The support/resistance zones are supported by the market profile indicator.
Technical Indicators
The short (25-SMA), medium (75-SMA) and fractal moving averages are trading below BCH/XBT which exhibits positive price movements in the respective timeframe. At the point in publishing, the short (25-SMA) and medium (74-SMA) term moving averages are in the process of having a positive crossover, which is also a bullish sign.
The KST is also confirming positive price movements with a bullish crossover. Also, the KST is channeling higher over the chart review period. RSI is trading above 50, which shows positive price momentum and approaching overbought levels.
Recommendation
Recommendation will be to go long around the 0.1494 price level with a stop loss at around 0.1436. Initial profit target level will be at 0.156. This produces a risk reward ratio of 1.18.

BCHBTC. LONG. Complete setup"Bearish market" they've said... BCHBTC is presenting full reversal MACD and chart pattern that will launch it close to the 61.8% Fibo. Follow me and find out!

(Update) BCH/BTC is ready to Go downward.Hi every one
BCHBTC
this is an update on the BCH/BTC pair that we have talked about earlier. as you can see the price has broken the neckline of the head and shoulder pattern and now is ready to Decrease to it's strong support (shown in the picture)
previous Analysis:
Thank you for seeing idea .
Have a nice day and Good luck

BCH 200MA Birth - Volatility Implied BCH has incredible potential
And this observation only exacerbates this potential
When the 200MA becomes visible, it allows the 50 and 100 to adjust to the 200's position
On the Bitcoin pair 1.618 is being tested, potential for a reversal
Incredible long term hodl

BCH/BTC bearish potential!Hi every one
BCHBTC
BCH/BTC pair has formed a Head and shoulder pattern but the neckline has not been broken yet! if the price loses this support we can expect a bearish movement back to It's more recent supports!
Thank you for seeing idea .
Have a nice day and Good luck


Can't stop. Won't stop. Bitcoin Cash.Payment coin season is coming.
I will not be rushing into a position.
I will be dollar cost averaging inside of this target window.

BCHBTC - 1HWe have an ascending triangle on the 1 H chart, if we can break horizontal resistance then we can confirm this pattern and the USDT pair should benefit from it as well.
For every new follower i will add a new idea :)


It looks dead.I am an amateur just shooting my ideas. Not advice.
If I check with FA perspective, BTC is being adopted by masses now, so its so called competitor will get much more worthless imo.


Bitoin Cash - Giant Sleeping Monster$BCH After almost 2 years, Indicator "Supertrend" showed a buy signal last week, which made BCH jump for more than 50%.
Next target should be in BCH Against BTC around 0,035 which means 3.5% of the price of one Bitcoin.
So if BTC stays around 58k-60k, One BCH should cost 2030-2100 US Dollars.
Bitcoin Cash is lagging a lot after other cryptocurrencies. It is one of the only ones, that did not pump as how much it needs to.
$BTC , $ETHEREUM , $LTC, $ETC have all reached previous ATH (All time high), it is now the turn of BCH to do the same.

