BCH: Sideways ChannelTrade setup : Trends are mixed and price is trading in a Sideways Channel ($218 - $260). Swing Traders can trade the range – Enter near Support ($218) and Exit near Resistance ($260). Trend Traders ought to wait for a breakout in either direction. If it’s able to break above $260 resistance, it could resume its uptrend and revisit $330 level from July.
Pattern : Price is trading in a Sideways Channel , which is a neutral pattern (indication of market indecision). Trend Traders ought to wait for a breakout in either direction, although typically it breaks in the direction of the existing trend. Swing Traders can trade the range – Buy near Support and Sell near Resistance.
Trend : Downtrend on Short-Term basis, Neutral on Medium-Term basis and Uptrend on Long-Term basis.
Momentum is Mixed as MACD Line is below MACD Signal Line (Bearish) but RSI ~ 50 (Neutral).
Support and Resistance : Nearest Support Zone is $200 (previous resistance), then $140 - $150. The nearest Resistance Zone is $260, then $330.
BCHBULLUSDT trade ideas

BCH Pump is Loading BCH Pump is Loading
After the last Breakout its still in another downtrend weekly trend if it breakout 2 X from here is very likely , keep an eye on it

INSTITUTIONAL PLAY OFF OF THE MARKET AND PROMO OFFER FOR BCHHello traders, i always stress the importance of trade plan and we can see what it takes to manage trades, we can see how over $100m of long positions got liquidated. i believe trading is beyond just buying and selling . we have to be strategic in our approach. Staying ahead of the game matters.
Tradehubng

BCHUSDTBCHUSDT has broken out of its consolidation phase and is currently forming a symmetrical triangle. My forecast is that it will break out, reaching a target of $353.

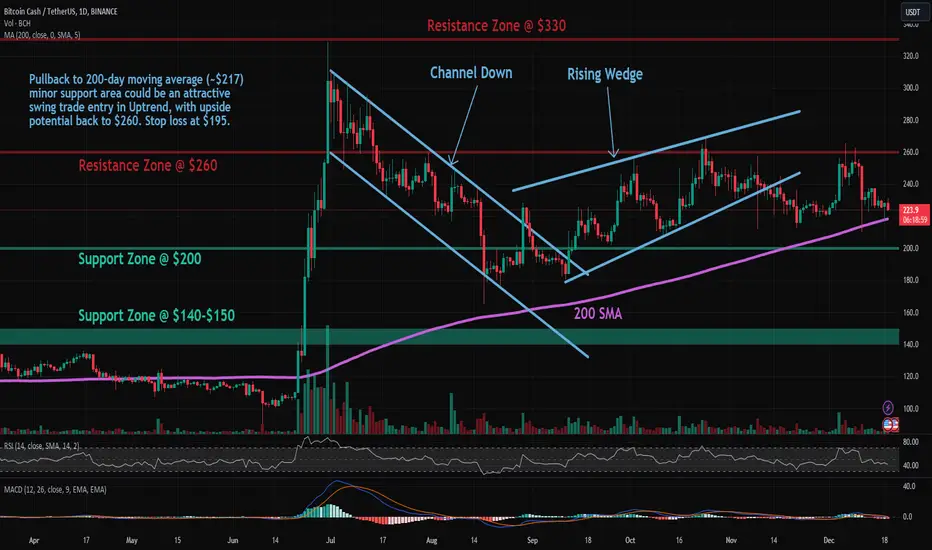
BCH: Pullback in UptrendTrade setup : Price remains in an Uptrend. Pullback to 200-day moving average (~$217) minor support area could be an attractive swing trade entry in Uptrend, with upside potential back to $260. Stop loss at $195. Price has been rejected near $260 resistance zone several times in the last three months, making this a critical level. If it’s able to break above $260 resistance, it could resume its uptrend and revisit $330 level from July.
Trend : Downtrend on Short-Term basis and Uptrend on Medium- and Long-Term basis.
Momentum is Bearish (MACD Line is below MACD Signal Line, and RSI is below 45).
Support and Resistance : Nearest Support Zone is $200 (previous resistance), then $140 - $150. The nearest Resistance Zone is $260, then $330.
BCH: Approaching ResistanceTrade setup : Price remains in an Uptrend, trading above 200-day moving average. However, it’s been rejected near $250 resistance zone several times in Oct and Nov. If it’s able to break above $250 resistance, it could resume its uptrend and revisit $330 level from July.
Trend : Uptrend across all time horizons (Short- Medium- and Long-Term).
Momentum is Mixed as MACD Line is below MACD Signal Line (Bearish) but RSI ~ 50 (Neutral).
Support and Resistance : Nearest Support Zone is $200 (previous resistance), then $140 - $150. The nearest Resistance Zone is $250, then $330.


BCH Long ScalpTook Long Position from 231 with tight sl at 229.
Expecting it to hold here and tap 250 at least.
Trade Type Risky.
RR 10
Note: Not a Financial Advice.

BCH ANALYSIS💥💥#BCH Analysis 🚀🚀
🔮 #BCH is trading in a Symmetrical Triangle Pattern and the price got rejected from it's trend line. A good move will be seen only if it breaks the trendline. If the price closes above above $255 then we will see a bullish move. 💸💸
📊Current Price: $233.2
🚀 Target Price: $390
⚡️What to do ?
👀Keep an eye on #BCH price action and volume. We can trade according to the chart and make some profits. Stay tuned for further analysis and stay updated with market sentiments and news.⚡️⚡️
🏷Remember, the crypto market is dynamic in nature and changes rapidly, so always use stop loss and take proper knowledge before investments.
#BCH #Cryptocurrency #TechnicalAnalysis #DYOR


BCH: Approaching ResistanceBitcoin Cash (BCH) technical analysis:
Trade setup : Price remains in an Uptrend, trading above 200-day moving average. However, it’s been rejected near $250 resistance zone several times in Oct and Nov. If it’s able to break above $250 resistance, it could resume its uptrend and revisit $330 level from July.
Trend : Uptrend across all time horizons (Short- Medium- and Long-Term).
Momentum is Bullish (MACD Line is above MACD Signal Line and RSI is above 55).
Support and Resistance : Nearest Support Zone is $200 (previous resistance), then $140 – $150. The nearest Resistance Zone is $250, then $330.


🔄 BCH: Fractals of Accumulation, Manipulation and DistributionIn the intricate dance of market dynamics, Bitcoin Cash (BCH) appears to be orchestrating a familiar tune, following the classic pattern of accumulation, manipulation, and distribution. Understanding this cyclical behavior may provide valuable insights for traders navigating the BCH landscape.
Chart Analysis: Unraveling the Pattern
Accumulation Phase:
BCH has entered a phase of accumulation, characterized by sideways movement and the formation of a trading range between $177 and $270.
Accumulation suggests the gathering of positions by savvy investors, preparing for a potential upward move.
Manipulation Dynamics:
Historical patterns indicate that BCH often experiences manipulation after accumulating within a range.
Traders should be alert to sudden and unexpected price swings as manipulation unfolds.
Distribution Anticipation:
Following the manipulation phase, BCH typically enters a distribution phase, where accumulated positions are released.
This distribution could lead to a swift decline, potentially revisiting lower support levels.
Projected Scenario: A Cautious Path Forward
Range Trading: $177 to $270:
Traders may anticipate range-bound movements within the $177 to $270 zone as accumulation continues.
Establishing strategic positions within this range might be a prudent approach.
Manipulation Swings:
Be prepared for sudden and sharp price swings, indicating manipulation in progress.
Active risk management is crucial during these volatile periods.
Downside Potential: $160 Target:
In the event of manipulation leading to distribution, a potential downside target is around $160.
This level represents a historical support zone that could attract buying interest.
Upside Momentum: $370 Objective:
Upon completion of the distribution phase, a swift reversal and surge towards $370 may unfold.
This upward momentum could signal the start of a new bullish cycle.
Strategic Approach: Navigating the BCH Landscape
Range Trading Tactics:
Traders can capitalize on the range-bound nature of BCH by strategically entering and exiting positions within the $177 to $270 range.
Risk Mitigation During Manipulation:
In anticipation of manipulation, active risk management, including the use of stop-loss orders, is crucial to safeguarding capital.
Long-Term Perspective:
Long-term investors may view the accumulation phase as an opportunity to accumulate BCH at favorable prices, anticipating the potential for a significant upward move.
Conclusion: BCH's Symphonic Movement
As Bitcoin Cash (BCH) dances through its accumulation, manipulation, and distribution phases, traders and investors alike have the opportunity to decipher the symphony of market dynamics. By understanding and strategically responding to these phases, participants can navigate the BCH landscape with greater confidence.
🔄 Accumulation in Progress | 📉 Anticipating Manipulation | 🔄 Distribution Patterns
❗See related ideas below❗
Share your perspectives on Bitcoin Cash's market movements, contributing to a collaborative analysis that enhances the collective understanding of this digital asset. 💚🚀💚

bch usdt pow 3 making it ready to moon
under this pattern its getting ready to break resistance and move up

WILL BITCOIN CASH DIP FROM HERE?This is my analysis of BINANCE:BCHUSDT
Let me know your thoughts about it.
If this is analysis makes sense to you, follow me now and support my idea.
Cheers!

Potential Surge to $305Bitcoin Cash is showing signs of an upward movement as it follows an uptrend line, hinting at a possible increase in its value shortly. For traders, it's wise to monitor the situation and wait for a daily candlestick to close above this uptrend line before making any trading decisions.
If this occurs, BCH could potentially target the key resistance area near $305.
This analysis is for informational purposes only and should not be considered as financial advice.

BCHUSDTStill waiting to touch my entry price then wait for a confirmation candle. My entry is on the Gap that is not filled yet.

BCH Bullish Setup👉 After a Breakout From The Bull Flag, Currently The Price Reached a Important 255$ Resistance Level ,I Expect a Breakout From This Level In Near Future, The Setup Is Bullish
📥 Targets Are 294$ And 430$

BCH is ready for a jumpThe strength of the bearers has been taken and the downtrend has weakened
A triggerline has been established and we have also had a bullish CH and orders have been received from the DEMAND zone.
Price is ready to move towards TP.
For risk management, please don't forget stop loss and capital management
Comment if you have any questions
Thank You

BCH/USDT Broke Out of a Descending Channel | 🚀👀 What's Next?💎 Paradisers, get ready for a promising trading opportunity with BCHUSDT. The asset is currently making significant moves in the demand zone, suggesting a potential shift towards an upward trend.
💎 BitcoinCash has been diligently following a descending channel. Its recent breakout from this channel suggests an upward move towards a resistance level, likely to be followed by a rapid pullback, aligning with its usual market pattern.
💎 There's a strong chance of a bullish trend starting from the support level at around $235. Having effectively broken out of the descending channel, BCH is now targeting resistance levels near $305.
💎 Timely decision-making is key for astute Paradisers. Pinpointing the most advantageous entry points during this upward trend is crucial, and it's wise to exercise caution to avoid entering at the height of the trend.
💎 Remain vigilant, as there is also a risk of BCH falling below the support level of $212. A decline below this important threshold could cast doubt on the sustainability of the upward trend.

BCH: Rising Wedge BreakoutBitcoin Cash (BCH) technical analysis:
Trade setup : Bearish breakout from a Rising Wedge pattern, could lead to a pullback to $200 support area (and 200-day moving average) in the near-term, which could be an attractive swing trade entry, with upside potential back to $250.
Pattern : Rising Wedge It usually forms after an uptrend and suggests a potential bearish reversal in the original uptrend. When price breaks the lower trend line the price is expected to trend lower.
Trend : Neutral on Medium-Term basis and Uptrend on Short- and Long-Term basis.
Momentum is Mixed as MACD Line is above MACD Signal Line (Bullish) but RSI ~ 50 (Neutral).
Support and Resistance : Nearest Support Zone is $200 (previous resistance), then $140 – $150. The nearest Resistance Zone is $250, then $330.

BCH: Rising Wedge BreakoutBitcoin Cash (BCH) technical analysis:
Trade setup : Bearish breakout from a Rising Wedge pattern, could lead to a pullback to $200 support area (and 200-day moving average) in the near-term, which could be an attractive swing trade entry, with upside potential back to $250.
Patterns : Rising Wedge It usually forms after an uptrend and suggests a potential bearish reversal in the original uptrend. When price breaks the lower trend line the price is expected to trend lower.
Trend : Downtrend on Short-Term basis, Neutral on Medium-Term basis and Uptrend on Long-Term basis.
Momentum is Bearish but inflecting. MACD Line is below MACD Signal Line and RSI is below 45 but momentum may have bottomed since MACD Histogram bars are rising, which suggests that momentum could be nearing another upswing.
Support and Resistance : Nearest Support Zone is $200 (previous resistance), then $140 – $150. The nearest Resistance Zone is $250, then $330.

