$BCH Long idea BCH can give us a huge profit until last target . I thing this will be a good trade . enter with min 4X - max 8X lev. and manage your volume . good luck
BCHBULLUSDT trade ideas

BCH is a rocketFrom where we placed the green arrow on the chart, the correction of BCH is over and the diamond diametric pattern has started.
Now it seems that BCH is going to start wave E of this diametric.
It can go up while maintaining the green range.
The target is the red box, actually the target can be higher but the red box is an important supply
Closing a daily candle below the invalidation level will violate this analysis
For risk management, please don't forget stop loss and capital management
Comment if you have any questions
Thank You

bitcoin cash ( BCH )bch usdt daily analyses
time frame daily
risk rewards ratio > 2
510 - 530 is good to enter
target 688$


Trading opportunity for BCHUSDTBased on technical factors there is a Buy position in :
📊 BCHUSDT
🔵 Buy Now
🪫Stop loss 485.00
🔋Target 1 565.00
🔋Target 2 625.00
🔋Target 3 699.00
💸RISK : 1%
We hope it is profitable for you ❤️
Please support our activity with your likes👍 and comments📝

Bullish RectangleThis model is considered continuous.
When the price moves sideways, we draw support and resistance and wait for the price to break through the resistance and then retest it
We enter buy after retesting.
We measure the target from support to resistance.
Stop loss under an important support or candle

BCH: The Top of 2024Bitcoin Cash is looking week in the current bull run of Oct/ Nov 2024.
I expect this idea to be the most likely.
Passing $720 is a cancellation. Breaking $320 is a confirmation of the idea.
The zone between $194 : $160 is the expected place to mark a major bottom.


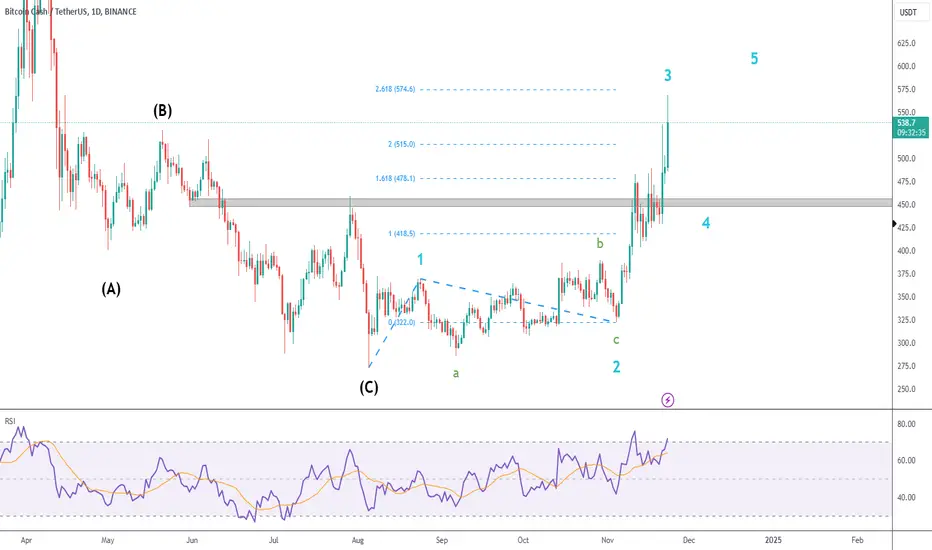
BCH Impulsive Wave
After wrapping up blue 5 / black C from my previous analysis, it seems that we have a bottom in place and a new impulsive wave is underway.
Blue 2 happened as a flat correction (green abc), and blue 3 should be in its final stages.
There is a solid support zone around 450, which could be an interesting level to look for longs in the blue 4 pullback.
Also note that blue 3 is an extended wave (over 250% of wave 1), so statistically we would expect blue 5 to not go much further high.
BCHUSDT wait for close up a weekly resis according to chart , BCH is crossing weekly resistance but is not closed yet . we are waiting now .
by attention that there is no resistance levels after 477 in weekly , if bch close up to this level we except to experience higher prices like 600 or more .

#BCH investment plan this will be my investment plan in crypto i'll be publishing 10 of my watchlist with prediction to break march top
buying area in blue 🟦
targets in green 🟩

Bchusdt will come back to its high lvl againYou can notice the low volume on the last correction from the last high in march
Still the trend is weak because it made only 23% correction from the big top in 2021 but as long as it closed a daily candle above it means that we can join the trend and our SL can be close one daily candle below it
The rest notifications are drawn on the chart

$bchusdt Long term trading planIm planning to trade based on arrow on the chart .I have two entry points for long and one entry point for short.
all the prices written on the chart,

Bitcoin Cash Long Setup Setting / Two sides of the MarketBINANCE:BCHUSDT
COINBASE:BCHUSD
📈Which side you pick?
Bull or Bear
SL1 ---> Low-risk status: 3x-4x Leverage
SL2 ---> Mid-risk status: 5x-8x Leverage
(If there is just one SL on the chart, I suggest, low risk status)
👾Note: The setup is active but expect the uncertain phase as well. also movement lines drawn to predict future price reactions are relative and approximate.
➡️Entry Area:
Yellow zone
⚡️TP:
379
385.4
391.9
399.3
🔴SL:
358.8
🧐The Alternate scenario:
If the price stabilize against the direction of the position, below or above the trigger zone, the setup will be canceled.

$BCHUSDT taked the target!BINANCE:BCHUSDT done it!
My congratulations everybody who trade this. But now its not the end.

BCH/USDTAfter finshed a elliot wave 12345-abc at price 291$, BCH will up to 471-498$ at wave 5 elliot (533$ if extension). SL at 300

Buy Trade for BCH: Harnessing Peer-to-Peer Digital Cash Growth**Description**:
This trading idea centers on **BCH** (Bitcoin Cash), a cryptocurrency designed to fulfill the vision of scalable peer-to-peer electronic cash. Created as a fork of Bitcoin to enhance transaction speeds and reduce fees, BCH aims to facilitate everyday payments and large-scale global adoption. With its focus on usability as a daily currency and a commitment to decentralization, **BCH** remains a relevant option in the evolving landscape of digital payments and financial inclusion. As interest in decentralized payment solutions grows, BCH's fundamental value proposition becomes increasingly apparent.
However, potential investors must be aware of the market's inherent volatility. Factors such as changing regulations, adoption rates, and macroeconomic conditions can significantly impact BCH prices. Thus, managing risks and maintaining an informed perspective are crucial when trading cryptocurrencies.
**Disclaimer**:
This trading idea is intended for educational purposes only and does not constitute financial advice. Investing in cryptocurrencies, including BCH, is highly speculative and carries significant risks, including the potential for total capital loss. Always conduct thorough research, evaluate your financial position, and consult with a professional advisor before making any investment decisions. Past performance is not a guarantee of future results.

$BCH ready to PUMP!BINANCE:BCHUSDT.P
Now this coin is ready to be pummeled. A good reversal from a strong support level has occurred and now is the time to get in the trade.
I think the price will move to the resistance level of $376, after which there will be a breakout and a rise to $440.
Subscribe to my reviews at the link below in the subscription.

Bitcoin Cash Turns Bullish Or Bearish Impulse? & BitcoinThis is a very interesting chart. I am going to assume that you are reading my other publications, and will weave some of the information shared on some of those on this one.
I mentioned how Bitcoin produced a higher high in November 2021 and then went into correction mode. This differed with many Altcoins that peaked in mid-2021 and failed to produce a higher high. Bitcoin Cash is one of those.
➖ In May 2021 BCHUSDT (Bitcoin Cash) produced an All-Time High and then started a major correction.
➖ Notice how a rounded top leads to a drop that pushes prices below MA200 (left side of the chart). The first low leads to a bounce and test of MA200 as resistance. Resistance holds and this leads to a major bearish impulse. This is back in 2021. At this time, Bitcoin is producing a higher high and later crashes.
The situation is the same in 2024.
See how Bitcoin Cash produced a major high in April. Bitcoin went higher and is producing a new high in October/November, now, while Bitcoin Cash and the rest of the Altcoins stay behind. This is the revealing signal.
We are now looking at the right hand side of the chart.
➖ A rounded top leads a drop that pushes prices below MA200. MA200 is confirmed as resistance and then comes the bearish impulse.
Bitcoin Cash is set to move lower based on these signal.
Bitcoin is set to do the same in the coming days.
Conditions for change
If BCHUSDT can move and stay above MA200 weekly on super high volume, bullish potential becomes active. Any trading below this level and we expect a major crash.
Any trading below the April 2024 peak price keeps this pair strongly bearish unless we see oversold conditions, that is, a major low is hit.
Thank you for reading.
I hope you find this information useful.
Namaste.

$BCH to $440BITMEX:BCHUSDT.P
I see another interesting pattern here.
We enter this trade carefully.
Entry: 375.4
SL: 361.1
TP: 440


Bitcoin Cash BCHUSDT Rockets to TP1! Remaining Targets on Watch!Technical Analysis:
On the 15-minute timeframe, Bitcoin Cash (BCHUSDT) has successfully hit TP1 in a long trade setup, showing strong bullish momentum. The price has moved above the Risological dotted trendline, signaling an upward breakout.
Key Levels:
Entry: 350.85
Stop Loss (SL): 344.45
Target 1 (TP1): 358.80 (Done)
Target 2 (TP2): 371.60 (Pending)
Target 3 (TP3): 384.40 (Pending)
Target 4 (TP4): 392.30 (Pending)
Observations:
The price made a steady climb after breaking through the entry level, driven by positive market sentiment.
Risological dotted trendline acted as support, boosting confidence for long positions
.
With TP1 successfully completed, Bitcoin Cash is now aiming for higher targets. Keep an eye on price action as it approaches TP2 and beyond, as the bullish trend looks likely to continue.
