BCH for Short positionPossible short for BCH. Immediate zone was broken and price is expected to further go down. Look for a confirmation candle on a retest area before going short for a good risk reward.
BCHBULLUSDT trade ideas


BCH/USDT Trading ScenarioAfter a successful accumulation phase, BCH experienced significant growth in June 2023, rising from $90.6 to $330.1, representing an increase of over 267%. This was followed by a new accumulation phase, with the subsequent resumption of an upward trend.
BCH has reached the trendline twice, which serves as support. The volume profile confirms the stability of the current upward movement, as market participants continue to move up along the trend.
Currently, the BCH’s price has decreased by more than 40% from its last peak. The POC level could represent an attractive entry point. However, the possibility of continued decline towards the trendline should also be considered, where maintaining the trend may offer even more beneficial entry points for the BCH purchase.

SHORT #BCHUSDTSHORT #BCHUSDT from $466.32
15m TF. The instrument has formed a descending structure in the form of a triangle, lowering the passing volume and price highs along the trend line, which indicates the weakness of buyers and the strength of sellers. The price is being squeezed towards a cluster of support levels with several touches, behind which unrealized liquidity has accumulated.
I will consider trading near the cascade and an impulse breakdown on the activity in the glass.

BCH - Perfect Short hit TP. NEW entry at PoC or VWAPBCH - Perfect Short hit TP. NEW entry at PoC or VWAP
I think we`ll fake a pullback to $500 or lover but we need goog entry point
at this moment i see 2 areas where i`ll take new short
1st) at PoC
2nd) at VWAP
watch full update

Short positionhello
watch out BCH for short position. you can see setup on the chart.
i could be good with 3x leverage.
i think the price will go down after hitting 590~ level


BCHUSDT long poosition good day traders BCH looks bottomed, lets take a long position and see the results, good luck to yo all, no financial advice only educational pourposes

BCH - Last pump was without Oi increase,1st signal for Reversal**BCH trading plan **
The coin did last pump without Oi increase
that's the 1st signal for reversal
we can trade 2 things
1st - Big SL hunt (knife) at key level
$650 or $694
2nd - break down
watch full plan

Bitcoin Cash may test 657 before moving lowerBitcoin Cash may test 657 before moving lower
Yesterday Bitcoin Cash broke out from a strong support zone located near 657.
The same broken support now turned into resistance can be tested again before the price
moves down more.
I expect Bitcoin Cash to test 595 and 570 initially as the price develops.
However, it can also move lower on a larger time frame.
I will update this chart again.
You may find more details in the chart!
Thank you and Good Luck!
❤️PS: Please support with a like or comment if you find this analysis useful for your trading day❤️

✴️ Alert! Bitcoin Cash Likely Starting Major CorrectionThis is a friendly, and hopefully timely, reminder to all my readers, followers and supporters — Bitcoin Cash is about to crash.
Well, not crash but we are going to see a drop and this is likely headed toward MA200... Please join me while I read this chart.
What do we have here?
We are looking at the daily timeframe.
Based on candlestick reading we can spot several signals right away. We have a shooting star, or close to one, on the 5th of April.
We have multiple red sessions and today's candle is ultra-bearish.
MA200 is sitting right now at 295 and this would be the main target mid-term.
Remember that it can take months to hit the support target, months of accumulation, months of recovery and then some more before the same high prices before the correction show up again. It can take anywhere between 2-3 weeks to 4-8 months... It varies depending on the pair and market.
This is a new move and it needs time to develop.
Altcoins: Many can grow while others retrace.
Each chart/pair needs to be considered separately.
We are entering a market phase with lots of variations when it comes to the charts and price action. The reason for this is the market success, as it grows, many projects detach from the herd and start to produce their own cycles. New categories are created as well as new trading vehicles and this changes the whole dynamic. This is good, colorful and varied is good.
Prepare for the drop.
This is just a friendly reminder.
Remember to do your own research and planning.
This is not financial advice.
Namaste.

BCHUSDTmy entry on this trade idea is taken from a point of interest BELOW an inducement.. I extended my stoploss area to cover for the whole swing as price can target the liquidity there before going as i anticipate.. just a trade idea, not financial advise

BCHUSDT.PHello Trader BINANCE:BCHUSDT.P
valid double top area yes for breakdown, higher high area has been touched and now on retest condition for short term.
Please add a comment and Positive feedback and constructive criticism are important to authors and the community.
Disclamer: Not Financial Advice


Bitcoin Cash crushing all resistanceHi everyone,
Bitcoin Cash price increased on 100% on this week and has reached 475 - 530 resistance area.
Bitcoin Cash didn't notice 380 - 420 resistance area but now this area might serve as support and BCH price can consolidate there before another pump.
In case if BCH price continues to pump it can reach 700 resistance level and afterwards retrace to 475 - 530 area.
If we look at the history usually BCH price doesn't pump for more than two straight weeks, so I guess that soon we can see some correction and probably consolidation before next pump.
I don't expect BCH price dropping much lower than 380 price level unless there will be strong correction on Bitcoin.
Please, do not forget to boost this idea & share it with your friends; thanks.

BCHUSDT analysis using Support and Resistancethis chart shows long and short analysis for BCHUSDT using support and Resistance values.

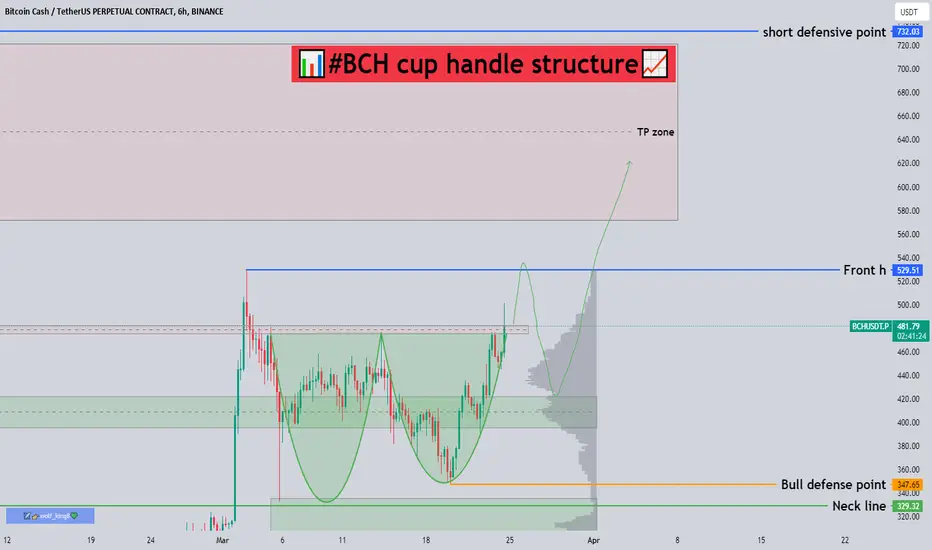
📊#BCH cup handle structure📈🧠From the perspective of the macro cycle, we still have not achieved our goals. We have been consolidating in the periodic resistance zone for a period of time. Currently, we have constructed a bullish cup-and-handle structure, so there is a high probability that we will use this structure as a supporting force to start rising.
Let's see👀
🤜If you like my analysis, please like 💖and share it💬
💕 Follow me so you don't miss out on any signals and analyze 💯
BCHUSDT.PHello Trader BINANCE:BCHUSDT.P
the potential to form a cup and handle area, for the right soulder is still fairly bearish chart. I have determined the entry point. please see the picture
Please add a comment and Positive feedback and constructive criticism are important to authors and the community.
Disclamer: Not Financial Advice

BCHUSDT 1W Where to sell Bitcoin Cash if the growth startsToday, we want to focus your attention on the global and maximum chart of the BCHUSDT trading pair
In August 2017, it was "a very hot summer": the alt season was in full swing, and there was also a BTC fork, as a result of which Bitcoin holders received free BCH 1:1. The same manipulation took place after during the fork of Bitcoin Gold - another sad fork coin.
After the fork, the BCHUSDT price soared to $4200-4400 on various exchanges.
And then the success story of BCH disappeared.
At the time when BTC during 2019-2021 was able to increase in price 20 times, the price of BCH could not even rise to half of the ATH indicator.
On November 15, 2018, the Bitcoin Cash blockchain was split (hard fork) into two branches — BCHABC and BCHSV.
There is also a lot of controversial information surrounding one of the biggest supporters and the organizer of the BCH fork - Roger Ver
In a word, we bypass such projects and do not trade it.
Now, about the chart
The 13th week of red candles and an uncorrected fall in the BCH price continues.
There is not much left to the absolute price minimum, in the area of $75.
We cannot recommend the purchase of this asset. At the moment, there are many different interesting projects for investment
If a miracle happens on the market and the price of BCHUSD does turn upwards , then on the graph we have shown where it would be good to sell off your BCH.
Here, each individual has to look at his deposit where he bought BCH and where it is profitable for him to sell.
Levels from above for sales: $250, $350, $550. The most positive and still weakly realistic forecast for the growth of the Bitcoin Cash price is $900
_______________________________
Since 2016 , we have been analyzing and trading the cryptocurrency market.
We transform our knowledge, trading moods and experience into ideas. Each "like under the idea" boosts the level of our happiness by 0.05%. If we help you to be calmer and richer - help us to be happier :)

Good level for short positionHello
I do not believe in market rise
I marked position on the chart. I think it’s a good level to short. So i entered.
Let’s see what happens


Bitcoin Cash(BCH): Good Point of TurnoverWe caught BCH with a good point of turnover, which seems like a good starter for further movement to lower zones.
We are looking here for the first orange line to be reviewed, from which we have two possible scenarios!
Swallow Team

Inflation Deflator Indicator Signals Sell for $BCHID has printed a 1h sell signal. The price has consolidated around this price and should drop soon to previous demand zone.
