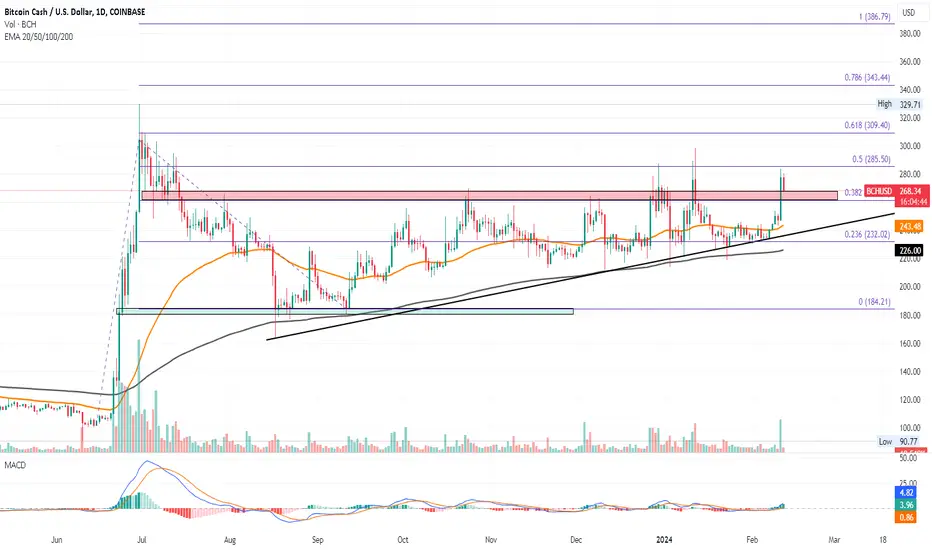
BCH price eyes $350 with this retestRetest Phase of $260 Barrier Breakout: Bitcoin Cash (BCH) is currently in a retest phase following a breakout above the $260 barrier.
12% Jump Challenges $285 Resistance: A significant 12% increase this Sunday challenges the overhead resistance at $285.
Potential to Reach $309: Crossing $285 could propel BCH towards the $309 mark.
Ascending Triangle Breakout: Signals an ascending triangle breakout, indicating potential for uptrend continuation.
Market Momentum Gains: As the market gains momentum, BCH is positioned for a positive trajectory aiming for new 52-week highs.
Influence of Bitcoin’s Bull Run: BCH benefits from the momentum generated by Bitcoin's bull run in its halving year.
Current Trading Price: BCH is trading at $269.53, experiencing a 2.90% intraday fall which serves as a retest of the bullish breakout.
Technical Indicator - MACD: Shows bullish divergence, supporting the breakout rally's continuation.
Potential Surge Influenced by Bitcoin Halving: Anticipated to have a positive impact on BCH and other related coins.
Altcoin Season and BCH’s Performance: With an upcoming altcoin season, BCH has the potential to outperform Bitcoin and possibly reach or exceed $350.
Optimism for BCH to Break $300: The current patterns and market conditions support a strong potential for BCH to surpass the $300 mark soon.
BCHUSD.P trade ideas

BCHUSDT LONGset your alarm once price get there long from there to the current top of the range.
wait for the best opportunity !


BCH Price Eyes Triangle Breakout To Cross $300Bullish Revival in Ascending Triangle: Bitcoin Cash (BCH) exhibits a bullish revival within an ascending triangle pattern on the daily chart, indicating potential for upward movement.
Reclaiming the 50-Day EMA: BCH's price action has successfully reclaimed the 50-day EMA, suggesting a strengthening bullish momentum.
Potential Rise to $260 Barrier: The current uptrend signals a possible rise to the $260 resistance level.
Breakout Run Towards $300: A successful breakout above $260 could propel BCH towards the $300 mark.
Bitcoin's Influence on BCH: The recent surge in Bitcoin price, driven by miners' reluctance to sell, serves as a bullish catalyst for Bitcoin Cash.
Technical Superiority Over Bitcoin: Historically, BCH has shown to outperform Bitcoin in technical charts, highlighting its potential for significant gains.
Price Prediction Beyond $500: With increasing expectations for a bull run, BCH price might project beyond $500 in anticipation of market dynamics.
Current Trading Price: BCH is currently trading at $247.49, with a recent uptrend marked by a 1.19% intraday jump.
Technical Indicators Support Bullish Recovery: The RSI indicates a resurgence in bullish momentum, supporting the ongoing recovery.
Impact of Bitcoin Halving on BCH: The upcoming Bitcoin Halving event is expected to positively influence BCH, given their connection.
Altcoin Season Potential: The anticipated early arrival of the altcoin season could see BCH and other altcoins outperforming Bitcoin.
Risk of Retesting Support Trendline: Despite the bullish signals, there's still a risk that BCH might revert to retest the support trendline if faced with resistance.

BCH/USD Projections Point to Promising Upside PotentialHello Everyone,
The outlook for BCH/USD appears quite promising at this stage, with further upward potential anticipated.
TradeWithTheTrend3344

BCH - Volatility INCOMINGBCH has the tightest Bollinger bands on the daily and weekly, what do we know from Bollinger bands? we know that volatility comes at expansion.
Does it expand up or down? According to it's history, the direction is up however we remain cautions and react at given levels.

BCH/USD Upside: Sooner Than Expected!Hello Everyone,
Anticipate an earlier-than-expected upside for BCH/USD!
TradeWithTheTrend3344

BCHUSD is potentially poised for a substantial price upswingBINANCE:BCHUSD BCHUSD (W)
BHCUSD may have a strong price increase coming up. Waiting for confirmation of price and volume explosion!
Following the preceding abrupt surge in price accompanied by elevated volume, BCH has undergone a correction spanning over 30 weeks, characterized by diminishing volume and price consolidation. The signal from the MA20 line consistently aligns with the evolving price dynamics.
Is it plausible to anticipate the occurrence of High Volume, accompanied by a substantial surge in price amplitude within this digital currency?
Follow us and read my status to follow more forexsignal !

CRYPTO TRADER, BCHUSD : NEW HIGH ? 13🌟TRADINGI trade mainly FOREX and INDEX but I quite like CRYPTOS as well. I usually trade the most known and main CRYPTOS, like BCHUSD. I find this structure is one of the cleanest today, compared to ETHUSD and BTCUSD for wich we need to wait a bit.
Always keep in mind, MARKET do just as it want, and it can give BUY SETUP and suddenly DROP strong, especially in the CRYPTO WORLD ! So always take the trade if you can protect yourself from other scenarios (3 shown here).
I will probably give this move a try, and will keep you posted in this topic.
Good luck !
13 Starz Trading

BchTarget for very short term , end of correction time to move up, bullish div
Holdd
(This not an advice, dyorrr)

BCHUSDTF: D
BCH rejected at the $290 to $330 range back in June 2023. This area of rejection aligns with the VAL of the previous bear market. The pair has been consolidating for several months, for any further upside the pair needs to break and hold above VAL for further upside. On the downside if price fails at the VAL and breaks below ~$210, then price may retest the $125 to $135 range.

Harmonic hidden pivot points High yellow Volume zone. Up reversal on its way. Red square struggle zone within the volumes.
Looks like it might dip to $248.98 where the harmonic pivot starts or might breakout through the white wedge line. Harmonic pivots gives great depth in an uptrend pattern.

+320% 900 is likely if it breaks 312, 410 resistence.Final:2180We are currently experiencing a potential third wave! The current market capitalization is around $2 billion, with an all-time high (ATH) of $24 billion. Therefore, there is plenty of room for growth. The monthly Exponential Moving Average (EMA) is currently supporting the price, and it is within a very thin channel that is likely to break upwards to form a wave 5.
The price is currently in an ascending channel, which could result in an upward breakout or even a fakeout within a month to reach the final target. Possible rejection might occur at the 900 zones due to two strong resistances. The first is the all-time descending top resistance, which it has never broken, and the second is the previous bull market ascending channel's bottom support. Breaking this might require a decent correction or pullback, lasting at least a month.
For the short term, if 312 breaks, then 410, which is the average/middle resistence of the decending channel and finally 900 would be a good area to close the position, to wait for the pullback. This crypto market is currently driven by institutional investors. If they invest and the market capitalization reaches a new ATH, it could potentially increase by 12 times, reaching $2,900, which is slightly above the target of the wave 3 on a bigger scale.
On a macro scale, if 900 is the target for wave 5 and a pullback occurs, it should not go below 312 to maintain the Elliott Wave 2. This sets the stage for aiming higher in wave 3 with a macro-scale target of 2,180. From there, in the following months or even years, we can aim for a massive wave 5, potentially reaching 13,370. However, for now, in the coming months, the most likely targets are 900 and then 2,180.
As per patterns, cup and handle pattern confirmation, if it breaks the resistance of 312 which have the short term target of 550..

BCH ready to top out around $600this will happen very fast. the current charts scream big money manipulation. this is what they want and do. they will full send bch shortly and sale its narrative. this is how the game is played.

BCH Price Analysis: Breakout Rally Eyes $350 MarkChart Pattern: Bitcoin Cash displays a bullish breakout of an ascending triangle pattern in the daily chart.
Current Stand: BCH price successfully maintains above $260, heading towards the crucial $300 level.
Breakout Potential: A sustained move above $300 could escalate the price rally towards $350.
Market Catalyst: Boosted by the Bitcoin Spot ETF approvals and Bitcoin's approach to $50K.
Trading Volume Surge: A significant 117% spike in trading volume backs the current price surge.
Technical Indicators:
MACD: Exhibits a bullish crossover, indicating a potential trend reversal.
RSI: Approaching the overbought zone, signifying growing bullish momentum.
Price Momentum: BCH currently trades around $293, with recent jumps suggesting an ongoing bullish trend.
Market Sentiment: Strong bullish sentiment fueled by ETF approvals and Bitcoin's positive price action.
Key Resistances: The $300 mark stands as a pivotal resistance; breaking this could lead to a further climb.
External Factors: Bitcoin Halving and potential rate cuts in 2024 could further catalyze BCH's price growth.
Potential Growth: With bullish market dynamics, BCH aims for a significant upside towards the $350 level.

BCHUSD (long)BCH has changed its daily range, new range resistance is at around 328-330.
i will be longing BCH once it get to below 290.
not risk more then 2%-3%.

Bitcoin Cash Is Still In A RangeFrom around the beginning of October 2023, EASYMARKETS:BCHUSD is seen trading within a range, roughly between the 210 and 270 levels. Despite the recent strong fluctuations in EASYMARKETS:BTCUSD , the rate of Bitcoin Cash stayed on the moderate side and within the given range. While the crypto moves inside that pattern, we will remain neutral. However, if the rate exists the range through one of its sides, that’s when we will consider the next short-term directional move.
A break through the lower side of the range could attract even more sellers, indicating a possible change in the direction of the current trend, potentially opening the door towards lower areas. We may then aim for the 180 hurdle, marked by the lowest point of September 2023. If that hurdle is not able to withstand the pressure from the bears, its break may send EASYMARKETS:BCHUSD to the lowest point of August 2023, at 161.
On the upside, a push through the upper side of the range may invite more bulls into the field, increasing the crypto’s chances off drifting further north. That’s when EASYMARKETS:BCHUSD could end up traveling somewhere closer to the 329 level, which is marked by the highest point of 2023.
Disclaimer:
easyMarkets Account on TradingView allows you to combine easyMarkets industry leading conditions, regulated trading and tight fixed spreads with TradingView's powerful social network for traders, advanced charting and analytics. Access no slippage on limit orders, tight fixed spreads, negative balance protection, no hidden fees or commission, and seamless integration.
Any opinions, news, research, analyses, prices, other information, or links to third-party sites contained on this website are provided on an "as-is" basis, are intended only to be informative, is not an advice nor a recommendation, nor research, or a record of our trading prices, or an offer of, or solicitation for a transaction in any financial instrument and thus should not be treated as such. The information provided does not involve any specific investment objectives, financial situation and needs of any specific person who may receive it. Please be aware, that past performance is not a reliable indicator of future performance and/or results. Past Performance or Forward-looking scenarios based upon the reasonable beliefs of the third-party provider are not a guarantee of future performance. Actual results may differ materially from those anticipated in forward-looking or past performance statements. easyMarkets makes no representation or warranty and assumes no liability as to the accuracy or completeness of the information provided, nor any loss arising from any investment based on a recommendation, forecast or any information supplied by any third-party.

BCH update [ MAJOR LIQUIDATION]At the moment, price is still retesting the current midvwap, but as soon as price break below 215$, sells towards 150$ come in play. On the other hand, price can still retest the current high at around 260$, but only if price manages to break above 290$ we shall start looking for buys continuation. Until then sells are more valid than buys, simply because liquidity has to be mitigated first.

BCH 6 years downtrend reversalThe BCH had gone through one of the longest consolidations in crypto world, but it's about to end finally, i drew all the possible projections based on price forecasting algorithms, let's wait and see how it turns out, but don't miss the chance to grab some share out of this or you will lose probably the greatest chance to get in BCH with relatively lowest possible risk

BCH you really need to take a look at this!!!Just drew up some easy horizontal levels for you to look at
if you plan on investing. BCH

if you didn't buy BCH/USDT then buy it know for profit Buy some BCH/USDT there is chances that the you could earn peer coin up to $120 in few days so don't miss opportunity love you all .

BCH Ready To Drive Beyond $300!Recent Performance: Bitcoin Cash (BCH) exhibits strong bullish momentum, with a notable 10% surge challenging the $280 resistance.
Critical Levels: Breaking past the 78.60% Fibonacci retracement level, BCH shows potential for further gains.
Upside Potential: Surpassing $300 could trigger an uptrend towards the $350 mark, showcasing significant bullish potential.
Market Dynamics: Despite Bitcoin's mixed performance, BCH carves its path, underpinned by positive market sentiment and increased buying activity.
Technical Analysis:
Triangle Breakout: BCH's bullish breakout from a symmetrical triangle pattern in the daily chart indicates strong momentum.
Post-Retest Reversal: A successful post-retest reversal after crossing $250 adds to the bullish narrative.
Resistance Challenge: Current resistance at the ascending trendline and the 78.60% Fibonacci level near $280.
Current Trading Price: BCH is trading at $278, showing a significant 9.59% increase within a day, forming a bullish engulfing candle.
Technical Indicators:
EMA: The 50-day and 200-day EMAs exhibit a positive trend, reinforcing the bullish outlook.
RSI: The Relative Strength Index (RSI) is in the overbought zone, indicating strong buying momentum.
BCH's Relation to Bitcoin: Potential approval of a Bitcoin Spot ETF could positively impact BCH, given its close correlation with Bitcoin.
Downside Risks: While the outlook is bullish, a trend reversal could see BCH retreating to lower support levels, possibly around $260.
Conclusion: BCH's current trajectory, coupled with broader market sentiments, positions it for potential gains, aiming for $350 in the near future.
Caption for Promoting BCH Price
