BchSo I talked about this upper level being critical reistNce. We did have a fake pop out of it but over a few hours we didn’t hold it as support. That’s why patience isn’t key to confirm holds. Sometimes, like Matic we will rip out of resiatnce hard but almost 99% of the time we come back to test as support. The higher we run before back test the less chance for a support hold. Anyways, we seem to be testing a neckline of a small head and shoulders. I am targeted 588 as this level of support hold if we lose 612-615 support we are hanging on. If we do drop we need to be cautious that 588 won’t hold as it doesn’t in most times it has tried however if that level is reached and it does hold , that would be a very bullish sign and will be a catapult for next run out and finally above 640 with a true hold!
BCHUSD.P trade ideas

BchIn a critical zone attack big resiatnce here at 640. Seems to love to eject here and fall all the way back to lower 588. If we can break here and hold support flag on top of 649+ this will be a huge stepping stone. If we get rejected 588 would be a great spot to hope for some support to hold to confirm a further run here!

BCHUSD 14 JUNE 2021 1700 hrsThat is massive volumee.
If it doesnt happen here, maybe one more level down before a potentially serious mark-up.
Ignore that volume at you peril.
Playing it level to level. But when i opened this chart up right now and saw this, this must be on teh target list.
Very careful short.

BCHUSDCOINBASE:BCHUSD is bearish. We are likely near the bottom, however, we need to wait for break to upside out of triangle.
Steps to take:
Buy at blue uptrend support OR break of $648 area resistance line if candle open close above OR multiple buy signals
Sell if candle open close below blue uptrend support
If BCH breaks down further below blue uptrend line you would buy at next support of $436 area


BCH/USD LONGBCH /USD LONG
**Still waiting for entry**
This is literally the exact opposite trade to the idea I posted two days ago - which would've played out great if I had held strong with diamond hands. Lesson learnt.
Here are my reasons for looking to enter a long position on BCH /USD.
The confluences for my entry:
✓ Holding at a key level of support
✓ Double bottom with May low
✓ TD 9 printed on 2hr candle
✓ Higher volume has been entering at these lows
✓ Stochastics crossing upwards - exiting the bearish control zone
✓ Krown Stochastic indicating a buy signal
✓ RSI momentum heading out of bearish territory into neutral
Concerns;
We are still in a strong downtrend on most timeframes. Will manage risk at EMA and Fibonacci levels.
I will enter a long position with a stop loss below the wick of the reversal candle/ TD Sequential 9 after a green TD1 confirmation candle next.
** this is not financial advice **

BchAlthough we broke down from a larger ascending triangle. Then created a descending
Traingle and broke down further. We started considlation between 566-588 588 came in as resiatxne. Whenever we broke it we pumped up to between606-640$. Now as we recently got rejected at 640 level we came back and are attempting to flip 588 into new support. As all of this correction in crypto occurs everyone is scrambeling to decide if this is a start to a bear market or correction in a bull market. As for alts they are going sideways as BTCD is picking up steam. I do belive this will contiue for a while however in BCH case even though it’s struggling to her higher then 730$ it is slowly setting it’s self up for potentially a big run later when dominance decides to fall. As long as we can from here on out, remain above 540-585 we should be doing pretty well. Keep eye on that 588isj level to contiue to hold as support !


BCH/USD SHORTBCH /USD SHORT
**Still waiting for entry**
**Will enter on confirmation of confluences starred below**
Here are my reasons for looking to enter a short position on BCH /USD.
The confluences for my entry:
✓ Strong overall downtrend
✓ Rejection of major key level order block
✓ Rejection at the 0.5 Fibonacci Retracement level
✓ TD Sequential printing a 9 on the 2HR
✓ Double top on smaller timeframes
✓ Crossing back below the 55EMA**
✓ Stochastics momentum heading down**
✓ RSI Momentum heading down**
I will a short position with a stop loss above the wick of the reversal candle/TD Sequential 9
** this is not financial advice **

Bitcoin Cash (BCHUSD): Harmonic Bat Pattern Spotted
Potential harmonic bat pattern formation is spotted on BCHUSD 8H chart.
The completion point of the pattern lies within a strong demand zone 468 - 502.
From that zone, a pullback will be expected.
Closest levels for goals:
613
715
❤️ Please, support this idea with a like and comment! ❤️
⬇️ Subscribe to my social networks! ⬇️

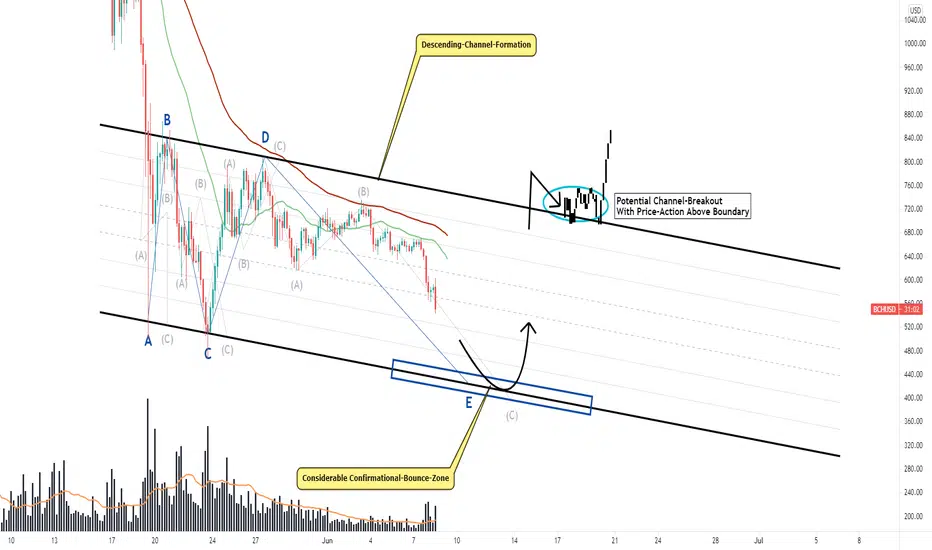
Bitcoin Cash, Developed Descending-Channel, Potential Breakout!Hi,
Welcome to this analysis about Bitcoin Cash, we are looking at the 4-hour timeframe perspectives. Bitcoin Cash has moved into an interesting constellation as it developed this main descending-channel-formation in the structure with the coherent wave-count within and the waves A to D almost already completed. Now Bitcoin Cash is moving forward with the protracted wave E that will complete the whole wave-count and when Bitcoin Cash manages to bounce within the confirmational-bounce-cluster marked in blue this can be the possible origin for a channel-breakout to the upside, therefore it is highly necessary that Bitcoin Cash rightly manages to bounce and show up with further bullishness to the upside, otherwise when falling below the lower boundary the bullish scenario can also invalidate, it will be an important development ahead.
In this manner, thank you for watching the analysis and great contentment for everybody supporting, all the best!
"The high destiny of the market is to explicate, rather than to speculate."
Information provided is only educational and should not be used to take action in the market.
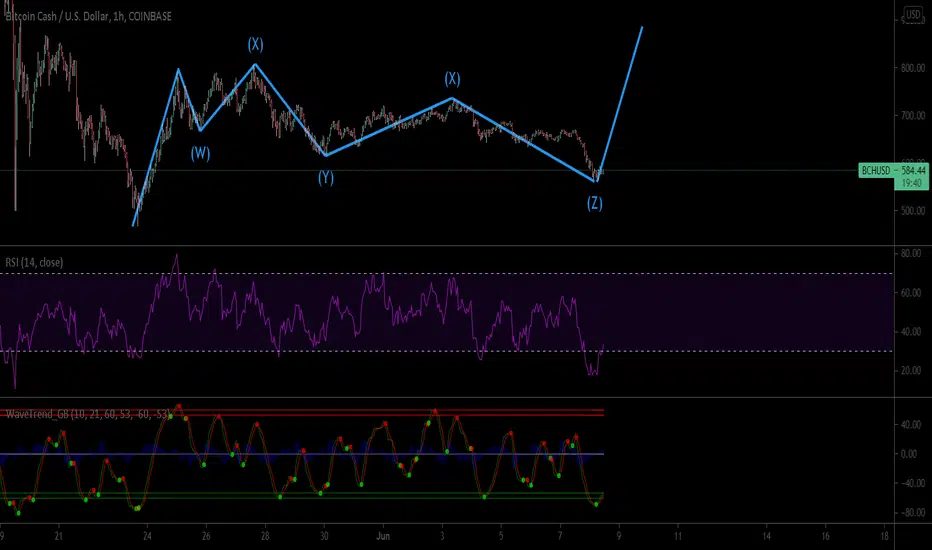
BCHUSD WXYXZ correction? Scalp to $880Looks to have completed a near-perfect WXYXZ structure which should see BCH move to the upside. Unfortunately, I see this as a corrective structure for more downside after it has played out. GL :)

BCHUSDI see a good look in the future for Bitcoin cash .
The pattern is unusual, but in reality it has a bull way (in my opinion).
Good luck with your trade!!!


It doesn't get more suspenseful than thisTonight we get resolution based on the termination of this wedge. Which way do we go???

BchSeems to be setting up for a nother pop above resiatnce. We can’t seem to find support on top of the patterns resiatnce but have popped it earlier this morning. This resiatnce comes in at 724. We need to find some support up here to show that we have finally exited this consildation. Don’t be faked out or fooled just keep an eye on 724 area also recent rejection came in at 735 so let’s see if we can see anything happen above that level also

A lot of Cryptos at the moment. Below is $BCHSo close!!!! You cant get anymore squeezed without some price action soon. My bet is on UP!

🚀₿𝙞𝙩𝙘𝙤𝙞𝙣 𝘾𝙖𝙨𝙝 at a crossroads ... 🤷♂️●● Mine scenario
● BCHUSD (COINBASE):🕐1D
"Fig.1"
The rise from the orthodox bottom of the triangle ④ formed a five-wave structure in the form of a diagonal, at least this variant of count can be applied to this structure in the context of the highest degree. The subsequent three-wave advance, which is labeled (2) , supports this idea. Cancellation of the scenario and, as a consequence, activation of the alternative wave count, - upon the breakout of the orthodox bottom ④ , the level "invalid" ..
● BCHUSD (COINBASE):🕐4h
"Fig.2"
"Fig.3"
Agree, the wave structure is extremely complex and its interpretation is ambiguous. Figures 2 and 3 show you two options for count, both of which are conducive to continued growth, the only question is: is the correction (2) formed or we are expecting a deeper rollback within the "black" count?
From the level of $ 600 there was a recommendation for a long-position. Upon reaching the levels of $ 880-1020 , we may partially reduce the volume of the long-position and prepare for a price decrease within the framework of an alternative count.
●● Alternative scenario
● BCHUSD (COINBASE):🕐1D
"Fig.4"
The global alternative wave-count suggests a large triangle in the primary wave ④ , within which a three-wave advance of the sub-wave (C) is expected.
The wave marking in the double circle parenthesis corresponds to the green marking in the circle on the chart.

BchIf we can hold this 714 level as new support this would
Be great we are nearing the end of the apex so can’t go much lower then 712 tbh unless it fake wicks down. Hasn’t broken out yet but it’s getting sqeezed. Def got my eye on this level we are at as well as watching BtC for its next move


