✴️ Bitcoin Cash, End Of Correction? I Read The Comments!Someone asked in the comments about Bitcoin Cash, an update...
Bitcoin Cash (BCHUSD)
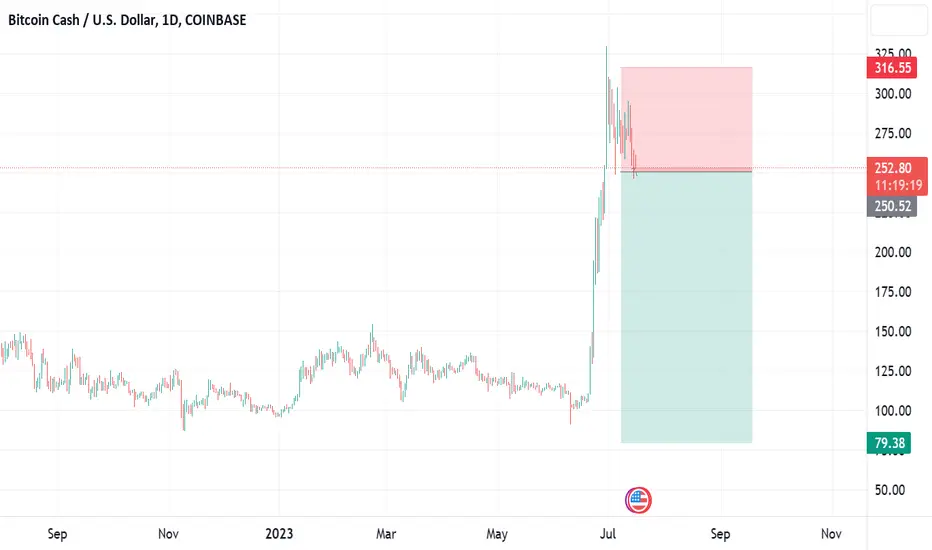
We are looking at the daily timeframe.
BCHUSD moved below 0.382 Fib. retracement and bounced before reaching 0.5 Fib., now moving back above 0.382, thus a bullish signal.
Today's session is really strong.
Closing above $236 can signal that BCHUSD is ready to resume growing. This stays true above $220.
Yes, Bitcoin Cash can resume growing.
That's my opinion/view.
It peaked 30-June, over a month of correction and the levels hit is more than enough.
If this changes, the charts are always changing, you need to define your own risk and stop levels but I wouldn't be surprised to see it go up.
Note: Candle close is needed for confirmation above $236.
The candle closes in 1 hour.
Do your own research.
I hope this answer your questions.
Thanks a lot for your comments and support.
Thanks a lot for the follow.
Namaste.
BCHUSD trade ideas

This is A Faithful StrategyTrading forex options is not easy
you will lose money instantly to gambling addiction
--
this is why you need
--
a faithful strategy to help
with your trading and buying the right
--
asset as you study and learn
trading
Watch this video to learn more

BCHUSDTHello Traders,
Short BCHUSDT as we can see in the chart clearly it is making the triple bottom and it suceesfully re-tested the resistence and now we can see a this to touch lower support.

BCHUSD CONTINUATIONA break below 230$ with a proper closure at that level can make price melt towards 200-180$. On the other hand, if price manages to retest the latest supply at 240$-260$ and confirm that sell orders are no longer the dominant part, we can easily see buys towards 320$ once price breaks and closes above 260$.

Bullish Flag in BCH price action, Will it reach $400?BCH coin price is resisting the trendline in the 4-hour chart, struggling to sustain above the $250 level, indicating underlying solid bullish sentiment.
At the time of writing, the BCH coin price shows higher price rejection in the daily candle, hinting at a negative cycle in the falling channel pattern.
Bitcoin Cash price could regain bullish momentum at $228 or the 61.80% Fibonacci level.
A daily candle closing above the falling channel could signal a new bull cycle, potentially challenging the previous swing high of $307.
On an optimistic note, the BCH price rally could exceed the $307 mark to challenge the 1.618 Fibonacci level at $435.
The MACD indicator is preparing for a bullish crossover in the daily chart, and the RSI line is displaying an uptick from the halfway line, suggesting a positive outlook for Bitcoin Cash in August.
On the bearish side, if the BCH coin price falls below $228, it could plunge to $200.

BCH CONTINUATIONA break below 230$ can easily push price towards 200-180$. From there, price has higher chances of moving upwards towards 340$ and even higher. On the other hand, a break above 290$ already can prush price above 300$, but only a closure above that level can confirm a bullish continuation towards 340$.

BCHUSD (4H) - Bearish breakoutHi Traders
BCHUSD (4H Timeframe)
The market is in a downtrend, and we are waiting for an entry signal to go SHORT below the 231.60 support level. Only the upward break of 255.70 would cancel the bearish scenario.
Trade details
Entry: 231.60
Stop loss: 255.70
Take profit 1: 217.00
Take profit 2: 193.00
Score: 7
Strategy: Bearish breakout

Almost that time again I’m going to wait for price to drop down to the last major support and 61.8-78-6 fib levels. Price will most likely reach 78.6 and that’s where I expect to see a reversal followed by a major upside move.

BCHUSD - Bearish TrendBCHUSD is showing a clear bearish trend with consecutive lower lows (LL) and lower highs (LH), making it an opportune moment to consider using the Fibonacci Retracement tool for potential entry point.

✴️ Why BCH Ultra Bullish Supports Altcoinseason (BTC, XRP & ...)Within 20 days Bitcoin Cash grew from a low of $90 to a peak of $328, a massive 261%.
The peak happened 30-June and from this date through 10-July, Bitcoin Cash hit a low of $231 or a 30% correction.
Now, this is ultra-bullishness.
20 days BCH grows by 260%, 18 days and the current price still trades above the 0.382 Fib. retracement level for the current bullish wave.
After such strong growth we normally see corrections and retraces move down fast to 0.618 Fib. ($179 in this case) or even lower, 0.786 Fib. ($138).
This is why Bitcoin Cash is super bullish, because its price continues super strong even after massive growth. No sellers around, people are ready to hold.
It is the same that is happening with Bitcoin and XRP.
Bitcoin continues sideways for an entire month now above $30K.
Then Ripple's XRP continues holding high with minimum retrace.
As this is happening, people not selling, deciding to hold... The rest of the Altcoins market continues to break up 2, 3 digits on and on...
This correction/bullish consolidation can extend but do not be surprised if you see another sudden price jump.
This will happen for the big Altcoins all at once, it will catch many people by surprise, it will be a good surprise and we are ready because we support the bullish side.
By the way, when the market becomes bearish that's exactly what I will say... I hope stones are not thrown at me when the time comes, instead we use the information to prepare and make the best decisions; take profits, secure profits and prepare to buy again when we hit support.
The market moves in waves, up and down, up and down... The cycles are the same but based on longer durations... My job is to alert before things happen; translating the charts.
Namaste.

BCHUSD (4H) - Bullish reversalHi Traders
BCHUSD (4H Timeframe)
Waiting for the upward break of 255.60 resistance level, which will complete a bullish trend reversal pattern to go LONG. Only the downward break of 237.30 would cancel the bullish scenario.
Trade details
Entry: 255.60
Stop loss: 237.30
Take profit 1: 266.30
Take profit 2: 284.10
Score: 8
Strategy: Bullish reversal

BCH BitcoinCash Bullish longBitcoin Cash (BCH) soars in value thanks to surge in crypto trading volume in South Korea
Bitcoin Cash (BCH) has seen a significant surge in value, crossing the $300 mark, fuelled by rising crypto trading volumes in South Korea.
The BCH/KRW exchange pair listed on Upbit, one of South Korea’s largest digital asset exchanges, saw a trading volume of $557.63 million in the last 24 hours.
This volume is nearly 3.5 times greater than the BTC/KRW pair on Upbit and 5.5 times greater than the BCH/USD volume on Coinbase, a Nasdaq-listed exchange.
However
the recent BCH rally may be driven by speculative motivations rather than underlying fundamentals.
Strategy Bullish
3Lots
2 Lots will be excecuted at Profit Target Zones
1Lot will follow the Trend
It will be only!!! excecuted ,if Bullish Trend changes
The stops will be delivered as soon as possible to break even,better some pips above the Buyinh price
I have marked my profit targets
Psychology:
1:The price is always right
2The Market is alwas right
3 The Chart is always right
4 IGNORE THE NEWS; Plan your trades and trade your plan.
5Drawdowns are partof the game
6 Risk management and money mangement is King!
7 wHATEVER HAPPENS;sTICK TO YOUR PLAN!
8 In a bear market no price is weak enough
9 In a bull market no price is strong enough
10 Patience !Wait for confirmation: Control emotions and tensions.

BCHUSD CONTINUATIONThis is the continuation of my previous idea regarding BCH sells from 270 towards 235 and 200 in the near future. Stay tuned for what's yet to come!

$BCH Ready for next move upI’ve been watching SET:BCH closely and it has become extremely bullish but also people are HODLing harder than ever.
There is a noticeable decrease in selling pressure after the 250% gains, and I believe we are primed for an increase in buying pressure and volume.
Fibs will show levels SET:BCH can touch, although, it is holding very strong so it may never see them. I have ghost candles showing my prediction with a move upwards towards $420.
NFA, DYOR
HELPME.CASH
TWITTER.COM/AYYFEZZ


Shorting the 76 parabolicLast addition to the crypto short portfolio. If we establish downtrends and I can trail stops into even I'll add to my positions, keep moving stops to even and then try to bulk up with no extra risk is conditions are suitable. If not, I'll get pinged on the swing trades and reassess my plans.

Bearish Trend Detected in BCHUSD - Potential Trading OpportunityGreetings, Traders! Today, we have an intriguing opportunity to discuss the bearish trend in the BCHUSD crypto pair. After carefully analyzing the 1-hour chart, we have identified potential entry, stop loss, and take profit levels for this trade. Let's delve into the details.
Crypto Pair: BCHUSD
Entry Price 1: 252.076
Entry Price 2: 252.176
Stop Loss: 256.638
Take Profit 1: 242.490
Take Profit 2: 247.146
Technical Analysis:
The BCHUSD crypto pair has been exhibiting a distinct bearish trend on the 1-hour chart. Recently, a bearish harami candlestick pattern has formed, confirming the bearish sentiment and providing a potential trading opportunity.
Based on this pattern and price action, we suggest entering the trade at two price levels: 252.076 and 252.176. These entry prices align with the bearish trend and provide an opportunity to capitalize on the anticipated downward movement.
Trade Plan:
Entry Prices: We recommend entering the trade at 252.076 and 252.176 to take advantage of the bearish momentum in the BCHUSD crypto pair.
Stop Loss: To manage risk, it is crucial to set a stop loss order at 256.638. This level will help protect your position in case of any unexpected upward reversal.
Take Profit Targets: The suggested take profit levels are set at 242.490 and 247.146, aiming to capture potential profits within the bearish trend. Adjustments can be made based on your personal risk tolerance and market conditions.
Please note that closely monitoring the price action is essential, and it's crucial to adjust your positions accordingly if the market dynamics change significantly.
Disclaimer: This analysis is based on technical factors and the bearish harami candlestick pattern observed in the BCHUSD crypto pair. Always conduct thorough research, consider other market factors, and seek advice from a qualified financial advisor before making any investment decisions.
Remember that trading cryptocurrencies involves substantial risk, and it's important to be well-informed and make informed decisions.
Happy Trading!
Disclaimer: The above post is for informational purposes only and should not be considered as financial advice. Trading in cryptocurrencies involves risks, and it is important to conduct thorough research and consult with a qualified financial advisor before making any investment decisions.

Bitcoin Cash at $300?After breaking out of a symmetrical triangle, the price pulled back offering a short stop entry opportunity.
Target: $297
Stop: $278


BCH – an interesting setupLooking at the recent interest in BCH and the short-term strength being displayed in BTC, I notice there is the potential for BCH to continue to out-perform BTC in the next move.
In this chart we see what appears to be a wave 4 correction and a bullish pennant that looks to be breaking to the upside. All this is occurring above the weekly pivot point with the next level of resistance around $390, just above the 1.618 projection of the wave 4 correction.
Could this portend a 38% gain?
It’s a possibility, as long as BTC continues to show some strength. But will that exhaust the recovery rally? A lower high in the RSI and MACD on this move could manifest a strong bearish divergence so we will have to wait and closely watch how things play out.
In the short-term, however, it looks like a burst higher might be on the cards.

✴️ Bear Market Action vs Bull Market Action | Bitcoin CashThe action that is now taking place on the COMPUSD (Compound) chart/pair pretty much confirms the Cryptocurrency market is ready to move forward. You can read this analysis with its update here.
Bitcoin Cash (BCHUSD) is not as revealing but still a pretty strong signal, let me explain.
After almost two weeks of hitting a new high Bitcoin Cash continues trading daily above EMA10.
After such a strong bullish wave;
After such strong growth (250% within 3 weeks);
You would a expect at least a really strong correction, a flash crash, shakeout or something of that nature... This is untrue.
Bitcoin Cash continues really strong and even printed a "bounce" candle yesterday when EMA10 was supposed to fail as support, instead this level has been confirmed as support.
Of course, it is still early and the MACD is quite bearish but the action is still strong. If BCHUSD resumes growing here or stays sideways, it would send out the strongest bullish signal about the coming weeks and months.
In isolation, this chart isn't that revealing but when considered together with Compound, Bitcoin, Litecoin, XRP and the rest, we start to get the picture that not many people are ready to sell.
Bear Market Action vs Bull Market Action
In a bear market, when prices are set to crash they do so fast and strong, this hasn't been true lately, each time a new high is hit we are going from rising to consolidation followed by additional growth.
Just go back to early and mid 2022 on any chart, see the sharp and strong declines we experienced all across. It is so much different now and that's the proof that we are set to experience additional growth.
Don't get me wrong, this pair can behave in anyway, after such strong growth I wouldn't be surprise if a strong correction does come but the other Altcoins that are yet to breakout are set to repeat this pattern rather than hit new lows.
But to be honest, I don't think we've seen everything so far, something is missing and that might be one last jump.
Then the correction, followed by consolidation and full blown bull-market in 2024. That's the bigger picture simplified... Think long-term!
Namaste.

BCH Performing SYMMETRICAL TRIANGLES BINANCE:BCHUSD.P
To trade symmetrical triangle patterns, a breakout is very important.
Wait for confirmation of a breakout candle . It should close below or above on either the support line or resistance line.
After the break, price is likely to move at least the same distance as the one it covered during the formation of the pattern after the break.
