Bitcoin Cash Price Forecast: Bulls Eye Break Above Key ResistanBitcoin Cash (BCH) is up 3% so far on Tuesday, extending its winning streak to a third straight session. The bullish momentum has propelled BCH above the critical $590 resistance level, which had held firm since July 28.
A strong daily close above $590 would likely open the door for a retest of the July 27 swing high at $604. If buyers maintain control beyond that point, the next upside target could emerge at the December 7 peak of $640.
Momentum indicators remain supportive of the bullish case. The Relative Strength Index (RSI) currently sits at 61 and is trending higher, suggesting upward momentum with room to run before entering overbought territory.
However, if BCH fails to hold above $590, a downside correction could take the price back toward the 50-period Exponential Moving Average (EMA), currently situated around $572.
BCHUSDT trade ideas

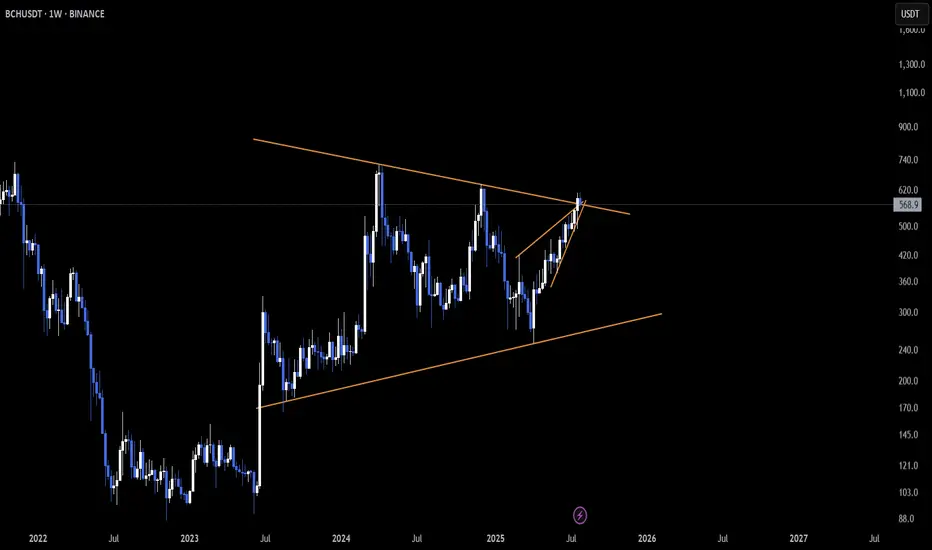
Bitcoin Cash Update · Good NewsBitcoin Cash has been facing the upper resistance of a long-term and wide bullish flag continuation pattern.
Overall, the chart is extremely bullish. Bitcoin Cash has been growing for 119 days. The action is very controlled with no large drawdowns. It is the perfect build-up pattern for a major advance.
It is good that the action this week is back above the upper flag trendline, as this confirms the market turning bullish. A red close last week and another red close this week would be bad and can point to lower prices. Instead, we have green this week and many altcoins are starting to recover, Bitcoin looks great.
Ethereum and XRP are trading much higher compared to Bitcoin Cash. We know Bitcoin Cash will not stay behind, so it is only a matter of time before we see higher prices. Maybe there will be some stability above $850.
There is still a long road to travel. Everything will continue to get better with each passing day. The market has been growing for months, four months to be exact, but this is only the start. Everything will be much better in the weeks ahead.
Namaste.

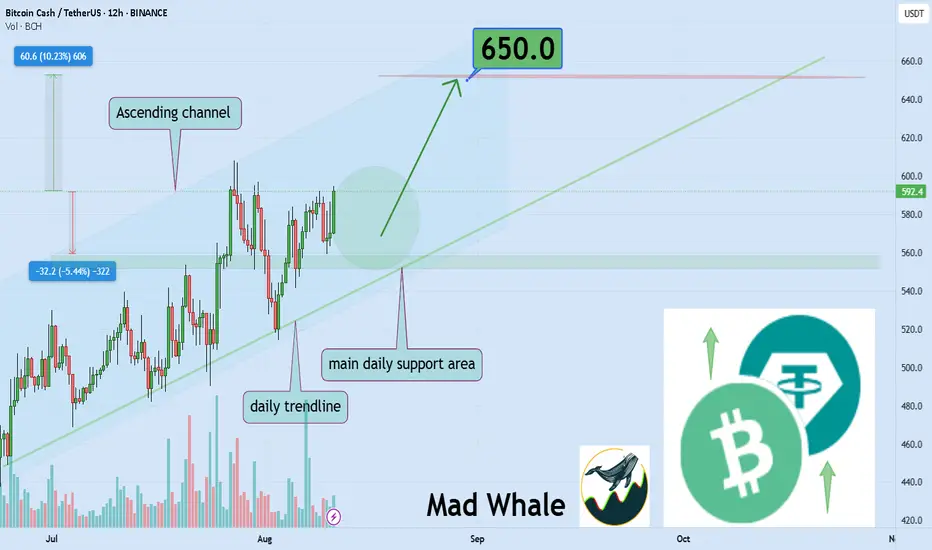
Bitcoin Cash Ready for 10%+ Rally, Targeting Strong 650 LevelHello✌️
Let’s analyze Bitcoin Cash’s price action both technically and fundamentally 📈.
🔍Fundamental analysis:
1. USDT Exit from BCH
Tether (USDT) will stop redemptions on Bitcoin Cash (BCH) by Sept 1, 2025, freezing all tokens left on that chain.
This could cut liquidity and push BCH under $509 if selling grows. 📉
2. Whale Activity Drop
Big BCH transfers ($100k+) fell sharply this month, thinning liquidity and adding downside risk.
Still, 85% of holders are in profit, hinting at strong hands. 🐋
3. Payment Adoption vs. Competition
BCH’s fast and cheap payments win merchants, but rivals like Arbitrum and Solana are faster.
The Velma upgrade aims to help BCH scale and stay competitive. ⚡
📊Technical analysis:
BINANCE:BCHUSDT is currently facing some headwinds on the fundamental front due to recent news. However, from a technical standpoint, it ranks among the most promising setups in the top 20 coins. BCH is trading inside a strong bullish daily channel 📈, supported by a solid monthly trendline and a key daily support level. These technical factors suggest a potential upside of at least 10% from current levels, with a target near 650 🚀.
✨We put love into every post!
Your support inspires us 💛 Drop a comment we’d love to hear from you! Thanks, Mad Whale
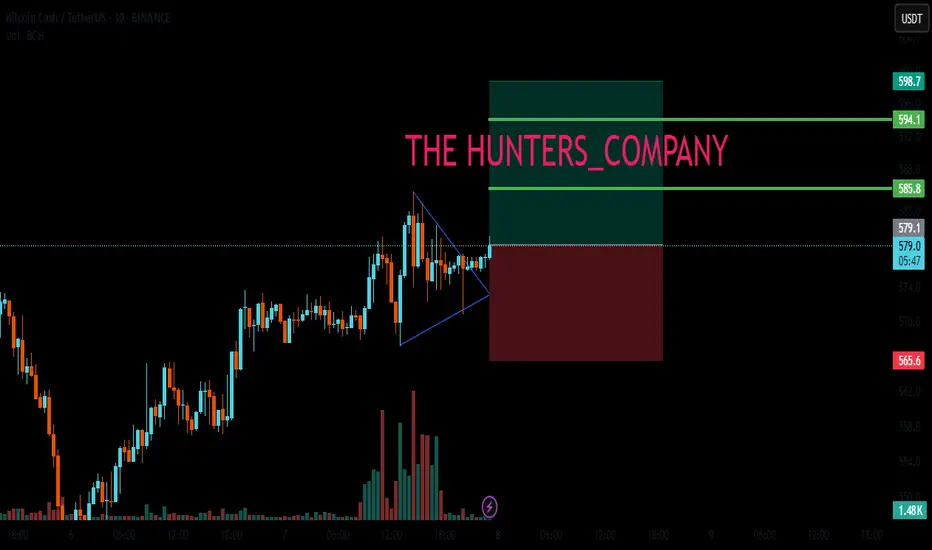
BCH : LIVE TRADEHello friends 🙌
✅Due to the good rise we had, the price has compressed and now formed a triangle.
Now with the valid triangle pattern, we can enter the trade with risk and capital management and move with it to the specified targets.
🔥Follow us for more signals🔥
*Trade safely with us*
"BCH/USDT Breakout Hunt | Strategy Armed and Ready"🚨 BCH/USDT Bullish Break-In: Layered Longs Loaded! 🔓📈
📌 Asset: BCH/USDT — “Bitcoin Cash vs Tether”
🧠 Plan: BULLISH Bias
🎯 Target: 625.0
🛑 Stop Loss: 554.0
🎯 Entry: Any price (layered grid style)
🏴☠️💰 Thief Trader Heist Strategy 💰🏴☠️
The vault's open and BCH is the next crypto to get looted! 🤑 The Thief Trader gang is eyeing bullish action with a GRID / Layering Entry Method, sneaking in multiple limit orders at various price levels.
📥 Entry Plan:
Drop limit orders like a true thief at swing lows / pullback zones.
Use 15M or 30M charts for sniper entries.
We don't wait—we layer. Entry is any price as long as it aligns with the Thief Plan.
🧨 Stop Loss:
SL set at 554.0 — Below structure lows & trap zone.
Risk managed based on lot size + number of entries.
Always trail when in profit to protect the bag. 🧤
💎 Target:
We're aiming to secure profits near 625.0
Escape earlier if market turns hostile—no greed in a successful heist.
🔥 Market Conditions
The BCH/USDT vault looks ready to burst 📊. Bullish flows, rising momentum, and overall strength in crypto sentiment signal a high-value robbery is underway.
✅ Best for:
🧲 Scalpers (only LONG side!)
💼 Swing Traders
💸 DCA/GRID players
📌 Reminder: This is a Day/Swing Heist Plan — not for impatient robbers!
🚨 News Risk Alert
📰 News drops = 🚧 Roadblocks for thieves.
Avoid entry during high-impact news
Use trailing SL to lock profit & escape volatility
🧠 Pro Tip from the Vault 🧠
Study the chart. Follow the Plan. Protect the bag.
💡 Winners don’t chase—they plan the perfect breakout.
💥 Smash the BOOST button if you love this heist plan 💥
📌 Follow for daily market robberies and crypto break-ins 🏆

The key is whether it can rise above 590.0
Hello, fellow traders.
Follow us to get the latest information quickly.
Have a great day.
-------------------------------------
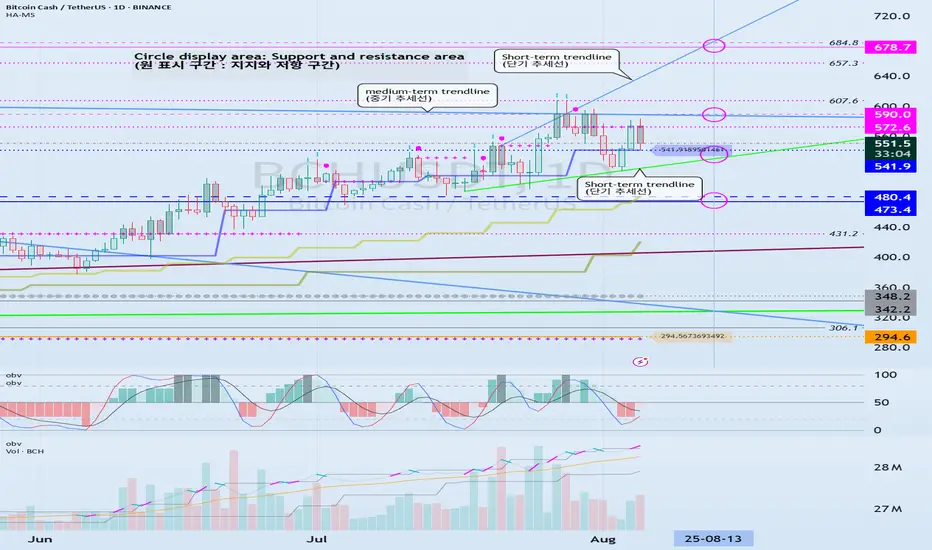
(BCHUSDT 1M Chart)
If the price holds above 473.4, it is expected to attempt to rise above 678.7.
-
(1D chart)
The key is whether the price can find support in the 541.9-572.6 range and rise above 590.0.
If it falls below 541.9, we need to check for support near 473.4.
The upward trend is expected to continue only if it breaks above the intermediate-term trend line.
-
Thank you for reading.
I wish you successful trading.
--------------------------------------------------
- This is an explanation of the big picture.
(3-year bull market, 1-year bear market pattern)
I will explain in more detail when the bear market begins.
------------------------------------------------------
Bitcoin Cash (BCH): Bounced From 200EMA | Successful BOSWe had a good bounce from the 200 EMA, where our buy entry was sitting as well—where currently we are witnessing the break of structure, which should give us another upside momentum here.
As long as we are above that 200 EMA, we are bullish, and currently we are expecting to see a smaller push after that successful BOS.
Swallow Academy

Bitcoin Cash Ready to Smash Resistance!CRYPTOCAP:BCH is holding strong above its rising trendline, showing solid bullish structure. Price is currently testing a minor resistance zone at the top, forming a potential double-top pattern.
If bulls can break through this level, we could see the pattern invalidate and momentum push for further upside continuation.
DYOR, NFA

BCH RSI Uptrend Signals Room for Further Gains BCH’s Relative Strength Index (RSI) is currently at 59.64 and trending upward, signaling strengthening bullish momentum.
The RSI, which ranges from 0 to 100, helps gauge overbought and oversold conditions in the market.
Readings above 70 typically indicate an overbought asset that could face a correction, while values below 30 point to oversold conditions and potential for a rebound.
With BCH’s RSI still comfortably below the overbought threshold, the ongoing uptrend—coupled with improving market sentiment—suggests that the asset may have room for further upside in the near term.

In-depth critical analysis of Bitcoin Cash$BINANCE: BCHUSDT
### Technical Analysis of Bitcoin Cash (BCH)
**Date: March 1, 2023**
**Current Price Action**:
Bitcoin Cash (BCH) has demonstrated a strong bullish response, bouncing off projected support levels. The significant bounce indicates renewed bullish sentiment among traders, suggesting that the bulls are back in the game after consolidation.
**Price Patterns**:
The breakout from the falling wedge pattern is a notable bullish signal. Falling wedges typically signify a potential trend reversal, and the break above the upper trend line means that momentum may be shifting towards the upside.
**Targets**:
Given the bullish breakout, the following price targets are established:
1. **First Target**: $425
2. **Second Target**: $450
3. **Third Target**: $475
4. **Fourth Target**: $550
These targets are based on previous resistance levels and Fibonacci retracement levels, which suggest potential price points where momentum could meet resistance.
**Support Levels**:
1. **Strong Support**: $290 - $270
This range has been tested previously and shown resilience, indicating a significant level for bulls to defend.
2. **Invalidation Level**: $240
A one-day candle close below this level would invalidate the bullish outlook and signal a potential shift to bearish market conditions.
**Market Sentiment**:
Overall, the market sentiment appears bullish, with increased buying pressure indicated by the bounce from support and the breakout from the falling wedge. If momentum indicators were bullish, this outlook would be further supported.
**Conclusion**:
The technical setup for Bitcoin Cash is positive, with key price targets set for the upside. However, traders should closely monitor potential pullbacks and the $240 invalidation level to reassess market conditions. Monitoring volume during any price movements is advisable to confirm the trend's strength and validate entry or exit strategies.
**Disclaimer**:
This analysis is for informational purposes only and should not be considered financial advice. Always conduct your research and assess the risks involved in trading cryptocurrencies.

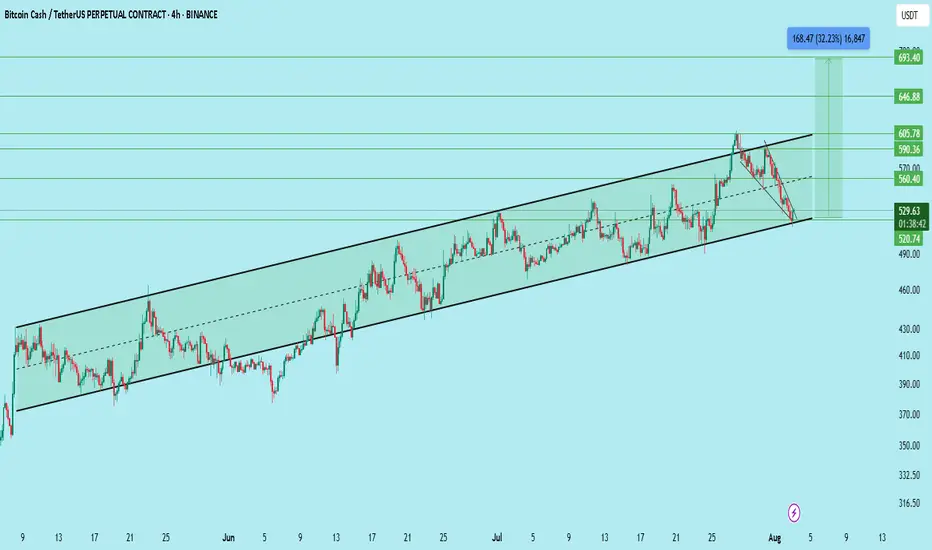
BCHUSDT : Potential Long Setup – Trendline Support Falling WedgeBCH has been trading in a well-defined ascending channel on the 4H chart. After multiple higher highs and higher lows, price recently corrected to the channel support and formed a falling wedge — a bullish reversal pattern.
Current Price: ~$528
Entry Zone: $520–$540
Stop Loss: Below $495 (clean invalidation below channel support)
Targets:
TP1: $560
TP2: $590
TP3: $605
TP4: $646
TP5: $693
Potential Upside: +32% from entry zone
Analysis:
The falling wedge breakout near channel support confirms buyer interest.
Volume drop during the correction phase supports bullish reversal conditions.
Risk-reward ratio favorable near the channel low.
Trade Plan:
Start building position between $520–$540 using DCA. Keep SL below $495. Expect gradual move toward the upper resistance zones if the breakout sustains.
Watch for breakout confirmation above $540–$550 for momentum entry.
DYOR | Not Financial Advice
#BCH Update #3 – July 31, 2025#BCH Update #3 – July 31, 2025
From a technical standpoint, Bitcoin Cash is currently one of the best rounding coins compared to others, and it hasn't broken its upward channel. It continues to move steadily within the trend.
It recently took support from the midline of the channel and made a move, though this move wasn’t very large — it stayed around a 4-5% profit range. It has now completed its correction, but if it drops back to the bottom of the channel and then rises again, the profit potential would be even higher. At the moment, there’s only about 4% upward space left before it meets the top resistance of the channel.
Bitcoin Cash is currently one of the most technically clean and consistent altcoins. If it pulls back slightly, it might be a better entry, but there’s no issue with entering from this level either. Therefore, I’m opening a 4.5% position here, with a profit expectation of 4.5%.

Bitcoin Cash (BCH): Looking For Touch To 200EMABCH looks overbought to us, and where we are now, we are looking for another touch to that 200 EMA, which would give us another good opportunity for long, so the plan is simple and that's what we are looking for.
Repeat of history, as they say!
Swallow Academy

BCH Lights Up Across Multiple Timeframes A Breakout Sequence 🚨 SET:BCH is unleashing strength across all major timeframes—and it’s not subtle.
📆 Daily: Defying the norm by breaking up from a rising wedge 📈
🗓️ 3-Day: Clean breakout above a descending trendline—momentum building 🔓
📅 Weekly: Exploding out of a long-standing pennant formation 🚩
This isn’t just another pump—it’s a multi-timeframe alignment, one of the strongest confirmation signals for technical traders. Price is currently in retest mode, and if support holds, the rally could accelerate fast ⚡
🧠 Grok Insights: Breakouts confirmed on 3+ timeframes see 2.6x higher continuation probability within the next 5–10 candles. BCH’s structure hits that mark.
👀 High-alert zone — this setup is rare, clean, and potentially explosive.
Do you see continuation from here, or is this a bull trap in disguise? Let’s talk.
Not financial advice.
Bitcoin Cash (BCH): Breakout Incoming | Possible 1:4 TradeBCH is showing signs of a breakout where price is pushing and pushing, which eventually might result in a strong and volatile breakout from here.
As soon as we see it, we will be looking for further upward movement towards our target zone (resistance area).
Swallow Academy

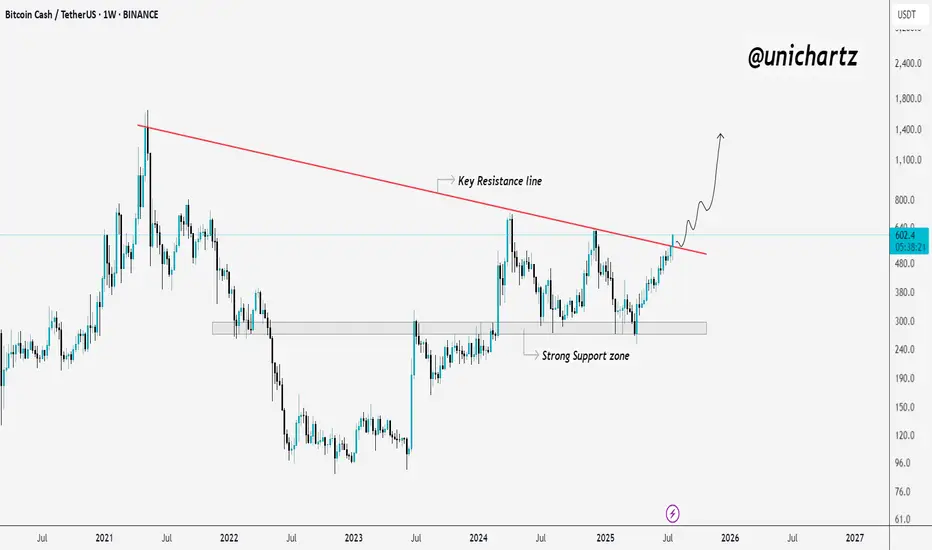
Bitcoin Cash Reclaims Momentum – Explosive Move Ahead?CRYPTOCAP:BCH Weekly Breakout 🚨
Bitcoin Cash just broke above a key multi-year resistance line, and that’s a big deal.
After months of consolidation above strong support, this breakout could trigger a powerful upside move.
If momentum holds, BCH might be gearing up for a run toward $800 and beyond.
Looks like the real move is just getting started.
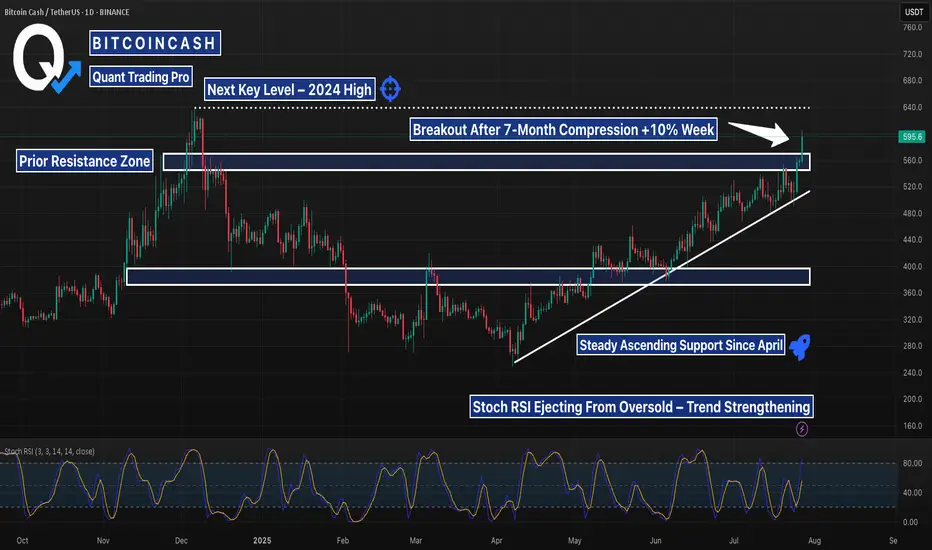
BCH Breaks Out of 7-Month Range — Eyes Set on 2024 HighsBCHUSDT 1D chart shows a clean technical breakout after months of slow grinding structure. Price has officially pushed through the $570–$580 resistance that’s capped upside since December 2023. This move comes on growing volume and renewed interest in BCH across crypto forums and analyst posts, with some calling it a long-overdue move for a top-20 coin.
The prior resistance zone around $430–$470 acted as a major accumulation range — now flipping into solid support. Price is also respecting a long-standing ascending trendline since April, showing consistent higher lows and steady bullish structure.
Stochastic RSI confirms momentum is shifting — pushing out of the mid-zone and suggesting trend continuation. With this breakout confirmed, the next major target sits near $640: the high from late 2024.
If BCH holds this breakout, it may be entering a new expansion phase. Watch for possible retests of $570–580, but structure favors bulls.
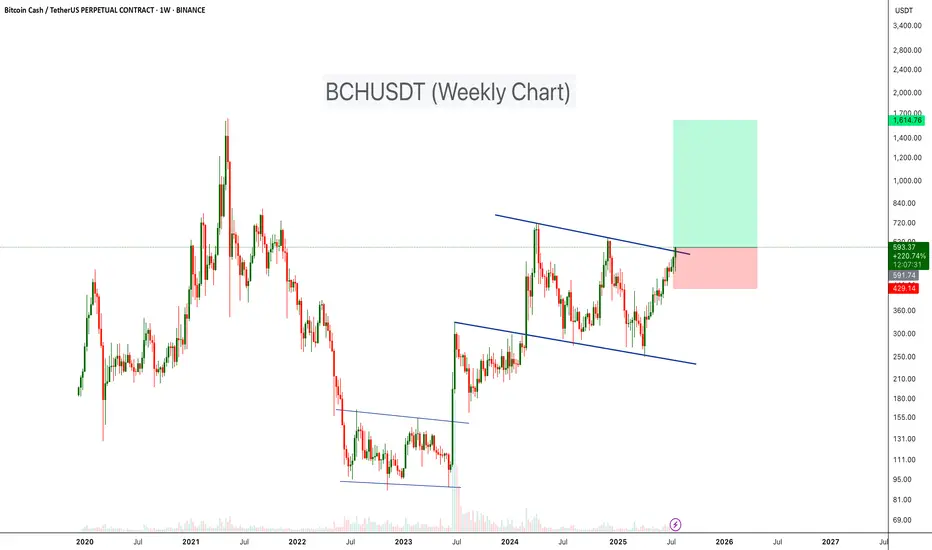
BCHUSDT Bullish ChannelBCH is currently testing the upper resistance of a long-term descending channel on the weekly timeframe, a level that has historically acted as strong resistance. After months of consolidation and a healthy recovery structure, BCH is once again knocking on the door of a major trendline breakout.
The price has steadily recovered from the lows near $250 and is now hovering around $590. A confirmed breakout above this descending trendline could trigger a larger bullish continuation, potentially propelling BCH toward the $1,600–$1,700 zone.
Cheers
Hexa🧘♀️
#BCH Update #2 – July 27, 2025#BCH Update #2 – July 27, 2025
After its last impulsive move, Bitcoin Cash experienced a full retracement. However, it managed to maintain its bullish structure by avoiding a close below its previous low.
At this point, it has reached its target and is still climbing. However, buying from here is a completely risky move. From a technical analysis perspective, Bitcoin Cash has already reached the extent of its potential upside.
Starting from this point forward, I absolutely do not recommend any long positions in Bitcoin Cash. Due to potential profit-taking by whales, a sharp correction is very likely.
I’ll provide updates as the situation develops, but for now, Bitcoin Cash is not in a suitable position for opening long trades. It has reached its target. Therefore, the best action at this stage is to wait.

Bitcoin Cash $2,615 Minimum · $4,178 Possible · Plan Ahead105 days. This is definitely the longest stretch of bullish action since 2021. Bitcoin Cash has been growing non-stop for 105 days.
If someone told you this would be the case some months ago or a few years back you wouldn't believe it. What if someone tells you now that you've seen nothing yet? What if I told you that the best is yet to come? This is only the build-up process. Bitcoin Cash is about to shoot up really strong. It will skew the chart. People won't be able to comprehend what is happening less adapt to the market. It will be chaos, bullish chaos.
Years of consolidation. Bitcoin Cash has been on a wide trading range since February 2024. We can easily say since mid-2023 if we consider using a wider range. This is all the build-up process for this moment now. The 2025 bull market. Predicted years ago, now it cannot be denied, it is right in your face.
Let's play the other side for entertainment's sake. Bitcoin Cash stops rising, either a lower high now or a reversal at the December or April 2024 high. What would happen then? A bear market? No! Just a down-wave, more consolidation before the final advance, price jump and market bull run.
Let's go back to reality for accuracy's sake. Bitcoin Cash will grow in bullish momentum and will break all resistance one next to the other, stops will be short. If there is a correction in-between the action, it won't be long.
Look back to the 2021 bullish wave, the fifth wave; notice three weeks red, two weeks red, one week red, etc., in-between the rising wave. Straight up but obviously, there are some stops. When we are in the experience, when it is happening, these weeks feel like forever and we never know if it will continue rising or if that's it, we reached the end. I am telling you now, it will not be over until a major new all-time high hits, and the levels are being shown now. When we are more advanced in the market cycle, I will not try to predict the short-term. Instead, I will tell you to secure profits and move on. Once prices are really high, close your position and start looking for the ones still trading low near support. Of course, writing this won't change anything, people will still be attracted to the action and mistakes will be the norm. Only if you bought early when prices were low, you will be able to withstand the market pressure. If you buy late, the market will kill you and take everything from you. This is a friendly reminder. Plan ahead.
Namaste.

Liquidity Sweep + FVG + RSIThis BCH/USDT 2H chart illustrates a textbook example of a liquidity sweep and reversal, backed by RSI confluence. Price repeatedly tested a horizontal resistance level, eventually triggering a breakout trap — enticing late buyers just before reversing.
The false breakout swept buy-side liquidity, trapping retail longs above resistance. Immediately after, price dropped back below the key level and formed a Fair Value Gap (FVG) — a common area where smart money re-enters positions. This signaled distribution rather than continuation.
Adding to the bearish confluence, RSI showed overbought conditions during the sweep, reinforcing that momentum was exhausted. Once liquidity was taken and RSI began dropping, a strong bearish move followed.
📉This setup combines multiple Smart Money Concepts:
🔁Liquidity engineering
🔁Breakout trap
🔁Fair Value Gap re-entry
🔁RSI confirmation

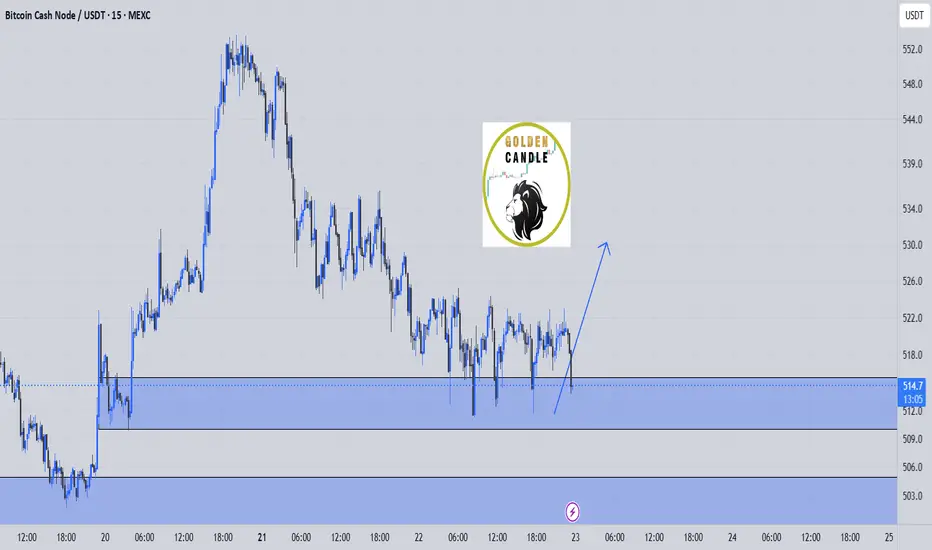
bch buy midterm"🌟 Welcome to Golden Candle! 🌟
We're a team of 📈 passionate traders 📉 who love sharing our 🔍 technical analysis insights 🔎 with the TradingView community. 🌎
Our goal is to provide 💡 valuable perspectives 💡 on market trends and patterns, but 🚫 please note that our analyses are not intended as buy or sell recommendations. 🚫
Instead, they reflect our own 💭 personal attitudes and thoughts. 💭
Follow along and 📚 learn 📚 from our analyses! 📊💡"
#BCH Update #1 – July 15, 2025#BCH Update #1 – July 15, 2025
Bitcoin Cash appears to have completed the correction of its latest impulsive move. The retracement ended at the 0.786 Fibonacci level, which also coincides with the 200 MA — a strong technical support zone.
Given this confluence, I opened a Long position targeting a 5% profit. I am not using a stop-loss because I plan to lower my average entry by adding more from lower levels if needed. Technically, the setup looks favorable for a Long trade at this point.
