Bitcoin Cash is the real bitcoinTaking another crack at a Bitcoin Cash long.
Blocksize debate coming back into contention due to lighting network failure. And it's being mined by BlackRock. If MIL:ETH is getting an ETF then SET:BCH will.
Still not sure about this. The chart looks so sleepy. WAKE UP
Targeting 450
Stop loss tight
BCHUSDT trade ideas

BCHUSDT 300$There has been a bit of suffering in the currency but I would like to say that you should be prepared slowly as the guard will go up and down to at least $300.🚀🚀🚀

BCH Trading Forecast: Bullish Momentum at $155 Level📈 Trading Forecast: Bullish Outlook for BCH as Long Position Opportunity Emerges at $155 🚀
Based on my comprehensive mathematical analysis and the formation of a bullish cup pattern on the weekly chart, I have identified a prime opportunity to open a long position on BCH (Bitcoin Cash) at the $155 level. This level aligns with key support and shows strong potential for an upward price movement.
📊 Technical indicators support this analysis, indicating positive momentum and increasing buying pressure. The cup pattern suggests a bullish trend reversal, with the potential for significant gains in the near future.
💰 With this valuable insight, traders can strategically position themselves to capitalize on potential profits. However, it's essential to monitor price action closely and implement proper risk management strategies.
🔎 Stay tuned for further updates and analysis as we closely track the market's movements. Happy trading and remember to always conduct your own research before making any investment decisions!
Disclaimer: This post is for informational purposes only and should not be considered financial advice. Trade at your own risk."
↪️Follow and see for yourself

BCHUSDT with strong Bullish setupBCH painting this bullish setup and price already break it upside. Looking forward to see how far this will go. We also have potential AB=CD
Kindly go through the chart and do leave us your comments to let us know how you feel about our view.
Moreover REMEMBER to appreciate our effort with your likes and always subscribe(Click follow) to our profile for fast and quick daily updates on all our trading ideas
Thank you.
BCH - Still Strong ↗️Hello TradingView Family / Fellow Traders. This is Richard, also known as theSignalyst.
📈 BCH has exhibited an overall bullish trend , trading inside the rising channel in red.
At present, BCH is undergoing a correction phase and it is currently approaching the lower bound of the channel.
Moreover, it is retesting a demand zone in blue.
🏹 Thus, the highlighted red circle is a strong area to look for buy setups as it is the intersection of the blue demand and lower red trendline acting as a non-horizontal support.
📚 As per my trading style:
As #BCH approaches the lower red circle zone, I will be looking for bullish reversal setups (like a double bottom pattern, trendline break , and so on...)
📚 Always follow your trading plan regarding entry, risk management, and trade management.
Good luck!
All Strategies Are Good; If Managed Properly!
~Rich

BCH 232 Long! Accelerate 300 usdt to 1000 on 5xBCH 232 Long! Accelerate 300 usdt to 1000 on 5x
Crypto trading marathon!
"Making 1000 out of 300 on 5 leverage".
Stop 230
Take profit 256.5
How many days will we need to accelerate the deposit?
7 days?
15 days?
30 days?
No way!
Write in the comments below!
Trade with us, trade better than us!

BCHUSDTBINANCE:BCHUSDT Short idea
i think short program started and first victim is BCH
⛔"Daily crypto market analyses I provide are personal opinions & not financial advice. Trading carries risks, so do your own research & seek advisor's help.#DYOR"
Don't forget to like and comment

LINKBINANCE:LINKUSDT
Examining the currencies that can be a suitable option for todayExamining the currencies that can be a suitable option for today

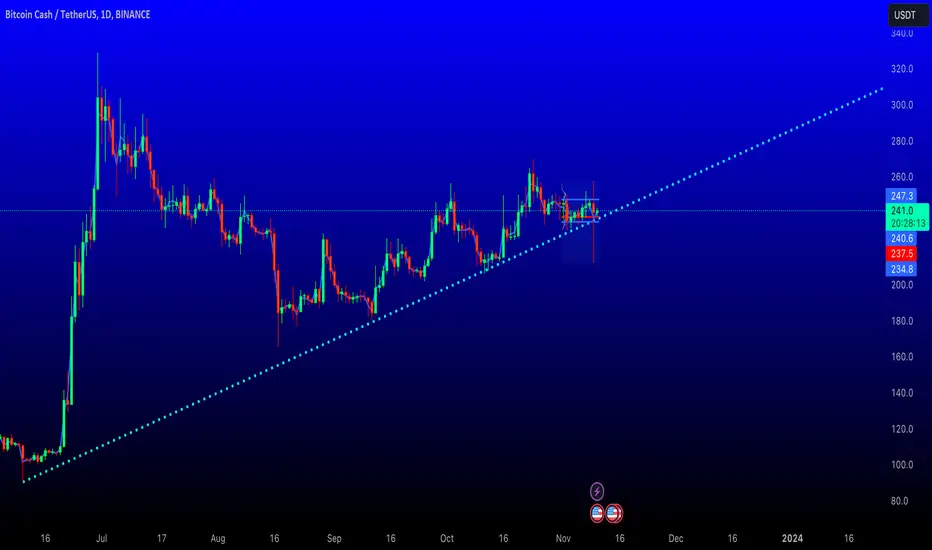
BCH BEAUTIFUL TREND! SO SEXY.Sometimes you just have to stop everything you're doing and admire a nice trendline. These market makers are having fun.
When will the trend break? Let me know in the comments below.
Calculate Your Risk/Reward so you don't lose more than 1% of your account per trade.
Every day the charts provide new information. You have to adjust or get REKT.
Love it or hate it, hit that thumbs up and share your thoughts below!
This is not financial advice. This is for educational purposes only.
BCH Lights the Path: Get In on the Buy Action Today!"**Fundamental Analysis**
* Bitcoin Cash (BCH) is a peer-to-peer electronic cash system that is designed to be a fork of the Bitcoin blockchain.
* BCH has a larger block size than Bitcoin, which allows for faster transaction times.
* BCH is also more decentralized than Bitcoin, as it has a larger number of nodes and miners.
**Recent News**
* BCH has been in the news recently due to its increasing adoption by merchants and exchanges.
* BCH has also been in the news due to its strong performance in recent months.
**Disclaimer**
Please note that this is not financial advice and you should do your own research before investing in any cryptocurrency.
**Additional Information**
* BCH is currently trading at $ .
* BCH has a market capitalization of $ .
* BCH can be purchased on a variety of cryptocurrency exchanges.

BCH/USDT Movement in the Bullish Channel. What's Next ???💎 BCH has certainly left its mark on the market. The current movement of BCH is characterized by an ascending channel pattern, often referred to as a Bullish channel. Presently, BCH faces a notable challenge in breaking through the local resistance zone at $251.
💎 It's evident that BCH encounters consistent rejection when approaching this local resistance level. To sustain its upward trajectory and reach our target area, BCH must successfully breach this resistance, the probability which is located along the supply and resistance trendline of the ascending channel.
💎 In the event that BCH fails to overcome the resistance area in the near term, there's a possibility that BCH will undergo a retesting phase either at the demand area or along the support trendline of the ascending channel in preparation for a renewed attempt to break through the $251 resistance.
💎 In the bad scenario, should BCH retest the demand or support the trendline, it's imperative for BCH to demonstrate a rebound. Failure to do so would result in BCH losing the demand area, thus confirming a bearish momentum. In this scenario, BCH may transition from a bullish to a bearish movement, potentially retracing to the robust demand area.

BCH/USDT Analysis - Bullish Channel and Reversal SignalDescription:
We have identified a compelling trading opportunity on the BCH/USDT trading pair. Here are the key aspects of this analysis:
Trade Setup:
Pair: BCH/USDT
Pattern: Bullish channel with three confirmed contacts on the support
Breakout: The price has broken above a secondary white trendline resistance
Confirmation: The crossing of moving averages adds strength to the buy signal
Bullish Reversal: A hammer candlestick, followed by a green candle, confirms a bullish reversal
Trade Parameters:
Entry Price: As the price breaks above the white trendline resistance
Stop Loss (SL): Set the stop loss at 292.4 to manage risk
Take Profit (TP): Aim for a target price of 262
Rationale:
The BCH/USDT pair is forming a clear bullish channel with three significant bounces on the support level.
The recent breakout above the secondary white trendline resistance suggests a potential upward movement.
The crossing of moving averages further reinforces the bullish bias.
A hammer candlestick pattern, followed by a green candle, provides confirmation of a bullish reversal.
Important Considerations:
Maintain risk management by setting the stop loss at 292.4.
Target a take profit level of 262.
Monitor the trade and make adjustments as needed.
This analysis outlines a potential buying opportunity in the BCH/USDT pair, supported by a bullish channel, moving averages, and a bullish reversal candlestick pattern. Always conduct your research and exercise proper risk management. #CryptoTrading #BCHUSDT #TradingOpportunity

Fib 50% short term continuationhopium because dry
posted for feedback
+ pa above 50% fib of the previous pump
+ high-risk swing entry; piggy back on shorter term bullish swing
on h4 distribution at 240 area, consider closing

BCH - holds support over TP1 and within channelBCH is a great asset with early bull run. I like the fact that it's holding TP1 and is above Tenkan / Kijun. It must stay inside the uptrend channel and TP2 is on the table soon.

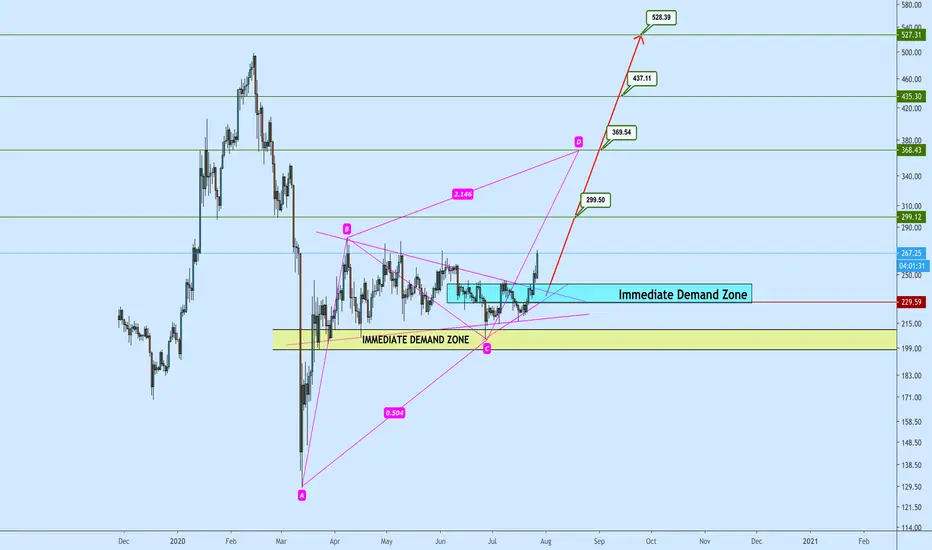
BCHUSDT - SHORTBCHUSDT, the trading pair for Bitcoin Cash (BCH) against the Tether (USDT) stablecoin, has shown some intriguing price action recently. It appears to be forming a rising wedge pattern following a retracement to the 61.8% Fibonacci level of the A-B impulse move.
Rising Wedge Pattern: A rising wedge is a technical chart pattern that typically indicates a potential reversal. It is characterized by converging trendlines, with the lower trendline being steeper than the upper trendline. In the context of BCHUSDT, this pattern suggests that while the price is making higher highs and higher lows, the upward momentum may be weakening.
Fibonacci Retracement: The retracement to the 61.8% Fibonacci level is a significant technical level. This level often acts as a potential support or resistance, and traders closely watch it for price reactions. In this case, the retracement to this level is noteworthy as it aligns with the formation of the rising wedge.
Trading Strategy: Waiting for a clear break of the lower trendline of the rising wedge is a prudent strategy. Typically, a breakout below the lower trendline may signal a potential reversal and a bearish move. Traders might consider shorting BCHUSDT or looking for opportunities to go long the USDT side (e.g., moving into a stablecoin) if they believe the price is about to decline.
However, it's important to exercise caution and use risk management when trading based on technical patterns. False breakouts can occur, and the market can be unpredictable. Therefore, it's crucial to confirm the breakout with other technical indicators, consider the broader market context, and set stop-loss orders to manage risk.
Additionally, staying updated with the latest news and developments related to Bitcoin Cash and the cryptocurrency market in general is essential, as external factors can influence price movements. Always ensure that your trading decisions are well-informed and aligned with your risk tolerance and trading strategy.

BCH has correction moovingThe BCH instrument showed a local preload, where the highs of the price gradually decreased, forming a figure known as a “descending triangle". This usually indicates the presence of a large participant in the coin with an increase in volumes. At the same time, there is a support level that was tested with a few touches when participants opened positions from this level and accumulated their stop losses behind it. I expect to see a gradual approach to the level with an increase in trading volumes and activity in the order book before the breakdown.

BCHA rather short picture emerges in this asset, let’s look at it. First, let's look at the local downward trend (it also acts as resistance), which formed after the upward trend was broken down. We tested it a couple of times, but we never saw any penetration.

Moving up to Supply Zone | Short BiasDay chart
Bitcoin Cash is trading at 255 now and slowly moving up to 290-300 that range is #SupplyZone
So I expect price will fail when hit that zone.
Time will tell

#BHSUSDT.P - GOOD PLACE TO GO LONG !When we look at #BCHUSDT.P, we see that it made a very sweet double bottom on the 1-hour chart. As a result of the fact that this double bottom is also formed at a nice support point and this is not enough, we have a total of 3 good data as a result of the Bullish Pennant being formed at the support point. of course, if we count the engulf candles etc., it seems like a very sweet trade. And i am in for a long position. The target is somewhere between $268-270.
Good luck!
No statement is investment advice !!!

BCH/USDT ↘️Hello Everyone 🙋🏽♂️
🔴 248.40
🟢 224.10
We are not responsible of any losses for anyone, our trades are profitable more for long terms and we take losses as everyone,
manage your lot size as well and your SL and TP
Don't forget to hit the like bottom and write a comment to support us.
Follow us for more 🙋🏻♂️
Best Regard / EMA Trading .
Disclaimer:
----------------
It's not a financial advise, As everyone we take losses sometime but for long term trading we are profitable traders, so manage your account well with SL and TP and your lot size to keep your account safe and stay in the market .

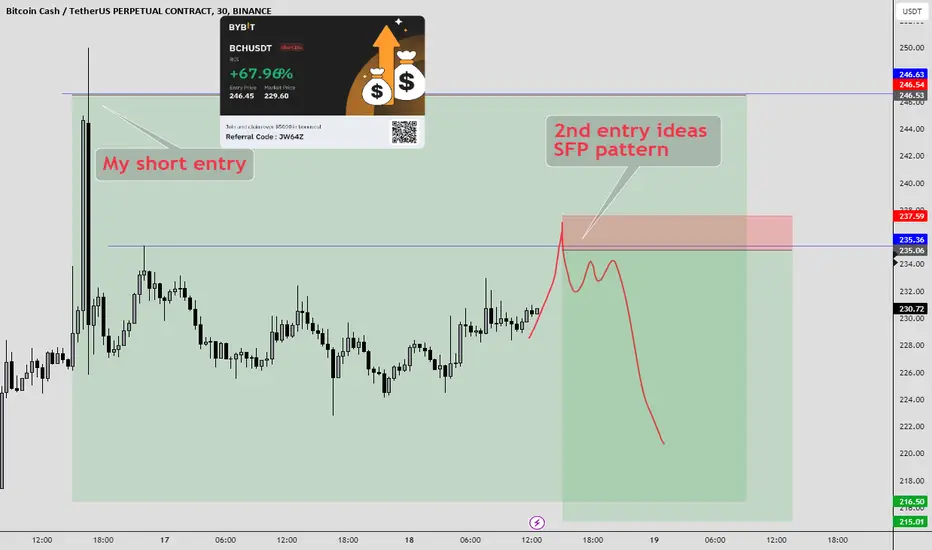
BITCOIN CASH IS READY TO CRASH? 😎📉Again, we are going to sell BCH at the level, but we use a reasonable stop loss.
Why is this setup is interesting to me even when the market is pumping at the moment?
1. There is a resistance at micro level
2. A possible breakdown of the trendline
3. Bearish candle formation
I will open short right away, and be patient!
NB: If my trade should hit SL, that would be a bullish confirmation for BINANCE:BCHUSDT and I will definitely enjoy the ride.
What are your thoughts about this analysis? Let me know in the comment box.
If this analysis makes sense to you, follow me now and support my idea.

BCH Full update and 2 trades that we took during this week BCH Full update and 2 trades that we took during this week
Lean how we took it
