BCHUSDT BEARISHBCHUSDT Bearish Trend and Bearish divergence also shown in RSI this mean the Trend is going to continue
we wait and watch for the breakout value
BCHUSDT trade ideas

#BCHUSDT | Long | Trade Set-Up#BCHUSDT | Long | Trade Set-Up
Entry Conditions
| Not Fully Test Weekly Pivot
| Watch out for EMA Resistances
| Bullish Signal
| CVD Trendline & Resistance Break
| General Bullish Divergence

BCH to the 133 +-?Another idea of a retest on BCH to the zone around 133, we'll see how it goes, the market can also crash every day, every hour, be careful with longs. I'm guessing that our summer is pretty low.

Weekend Crypto analysis: BCH looks set up to move into higher raKUCOIN:BCHUSDT
From the weekly perspective, I think BCH is set up to move up into a much higher range. This is indicated by the candle which attacked the solid purple level 148.73, which is a weekly break level. Attacking this confirms the breakdown of that cycle, invalidating the downtrend, and confirming the likely move up into a monthly range.
But first, we have some work to do.
The next price target for a short or to close a long would be at the daily hold level at. 130.36, which is on the daily is the next “untested” level of resistance we will be looking to test.
On the 4hr, we have alrdy hard closed the red down trend, which means we must do so on the daily. (Hard close means the bottom-side of the accumulation candle where price “opens” must close above the trend)
As indicated by my yellow triangle, we must break thru and backtest the topside of this accumulation zone for us to confirm the higher range.
I would argue anything within this yellow accumulation zone would be a solid long for the potential 9% move up.
**this is simply my personal analysis and not intended to be financial advice**
open.substack.com

BCHUSDT could have bottomedAfter price found the support at 61.8% Fibonacci retracement level, we could see quite a strong demand. Right now price has corrected down, offering yet another opportunity for buyers.

BCHUSDT - tring to cash this oneBCHUSDT has made a beautiful cup and handle pattern and the price just broke out from the downtrend at the edge of the handle... a very good text book chart pattern...
let's see if it can reach the targets.


#BitcoinCash Is Bullish, More Upsides Expected Above March HighsPast Performance of Bitcoin Cash
BCH prices remain wavy inside a bull flag from the range defined from December to April 2022. For now, traders can look to ride the uptrend from a top-down preview. However, this will largely depend on the reaction of prices at around HKEX:136 , marking March and April highs. On the lower end, support is at around $130.
#BitcoinCash Technical Analysis
The recovery of prices from mid-March shapes the current price action. There is a double top though the trend is negative slanting. Resistance is around the HKEX:136 zone, while support flashes with the high of April 3. The bar is bullish, engulfing, and wide-ranging, which initiated the recent breakout and drive to spot rates. Therefore, unless there is a comprehensive push above HKEX:136 and the resistance trend line, the odds of contraction below HKEX:130 towards HKEX:120 remains high. If bulls take charge, BCH may float to Q1 2023 high of $145.
What to Expect From #BCH?
BCH remains volatile and moving inside a tight trade range, as seen in the past two days. Still, bulls have the upper hand. Buyers from mid-March 2023 could spill over, providing the impetus for a leg up toward HKEX:145 in a refreshing bull trend continuation.
Resistance level to watch out for: HKEX:136
Support level to watch out for: HKEX:130
Disclaimer: Opinions expressed are not investment advice. Do your research.

BCHUSDTTP1 is 170, TP2 is 230, and TP3 is 270. Expectations are quite significant, especially when looking at weekly and daily candlesticks. There is potential for a pump if the crypto summer arrives, and take profits above 400 are quite possible. However, it is unlikely that the pump will be very strong, and it is probably not worth expecting prices above 500. This is only possible if there is at least minimal trading activity in the range of 280-390.

BCH/USDT possible scenario Hey 👋
Another coin on our watchlist today is going to be BCH coin. We see currently how price has rejected that upper resistance zone and might as well head towards EMAs there. We will be looking for a breakdown of EMA zones there or if we see a re-test towards resistance zone this would be an additional confirmation for us to short this coin on that level.
If you like ideas provided by our team you can show us your support by liking and commenting.
Yours Sincerely,
Swallow Team 🔱
Disclamer:
We are not financial advisors. The content that we share on this website are for educational purposes and are our own personal opinions.

#BCH/USDT - Long - Potential 6.81%Direction: Long
Market: Spot
Risk: 0.25% - 1%
#USDT_BCH
Exchange: BINANCE
Timeframe: 360
TP1: 142.8
Entry: 133.6
STOP: 124.4
Entry Conditions:
| 200MA breakout
| Trendbreak

✴️ Bitcoin Cash 185We already looked at this many times... Now it just needs to happen.
185 Next target.

BCH can reach 155$Bitcoin cash has Created a Bullish Flag Pattern which means the price shall increase pretty soon! The price will reach around 155$ .
_ _ _ _ _ _ _ _ _ _ _ _ _ _ _ _ _ _ _ _ _ _ _ _ _ _ _ _ _ _ _ _ _
🌍Thank you for seeing idea .
Have a nice day and Good luck

BCHUSDTThis is my view on BCH explained further down, but first a warning to my fellow traders out there.
-----------------------------------------------------------------------------------------------------------------------------------------------------------------------------------------------------------------------------------------------------
Binance scammed me one 20k USDT equity on the "crash" 23rd of March... Yes, it was a coordinated scam.
*** WARNING, BE AWARE, #BINANCE #KUCOIN #BYBIT - SAME OWNERS - SAME SCUMBAG SCAMMERS -- DEPOSIT AT YOUR OWN RISK. MY WARNING HAS BEEN MADE ***
are you going to top up credits again and "maintenance" for 4 hours and crash the market? You did a good job covering the dusts and make it look
like a 1 hour "spot-trader" affected only-maintenance. Yeah.. Right buddy. CZ, enjoy your freedom as long as it lasts.
#Binance
#KuCoin
#ByBit
-----------------------------------------------------------------------------------------------------------------------------------------------------------------------------------------------------------------------------------------------------
Now to my point, what I believe is that BCH might be a major player this year, since 2017 it has been supressed. And it's a top 5 coin that has lost billions and billions of market cap, into whos pockets?
BINANCE POCKETS.
Personal view on BCH is that the price have ZERO volumes at this stage, no one is selling anymore, no big money atleast, only panic sellers.
My approach is to HODL this coin and give it some time. There wont be a disappearing BCH, this scenario is made by BTC maxis..
2017 Wave BCH did outperform most coins, 2020 run ALL the 2017 coins been constantly dumping for other coins (NFTS for example)
This means, all the XRP, DOGE, ZCASH, QTUM, BCH, IOTA you name it - All the big players from 2017 will BE BACK!
IIIIIIIIIIIIIIIIIIIIIIIIIIIIIIIT'S PUNIIIIIIIIISH TIIIIIIIIIIIIIIIIIIIIIIME - FILL MY BAGS TIME, YES BABY, DROP THE PRICE MORE IF YOU CAN ;) Ohh... It's not a suitable time for "maintenance" right? You recommended your "fellow Binancians" to sell all their assets to protect losses, and Binance words that they will refund was COMPLETELY BULLSH*IT.
----- IF YOU NEED EVIDENCE OR HAVE A LAWSUIT AGAINST BINANCE, LET ME KNOW SO I CAN SHARE THE EVIDECE ----
------------------------ My Lawsuit will begin on Tuesday once the Swedish SEC open, since It's a red day in Sweden on Monday, It's going to happen on Tuesday. --------------------------------------------------
Filling pockets as much as I can as long as it lasts.
** THIS IS NOT A FINANCIAL ADVICE, THIS IS ONLY MY APPROACH TO THE MARKET, AND MY WARNING TO ALL FELLOW TRADERS OUT THERE **
- Avoid Chinese exchanges. Every single one of them scammed me, and Binance was the last one to steal my remaining equity on the "maintenance" 23rd of match -
IF YOU NEED REFERENCE FOR MY CLAIMS, PLEASE GOOGLE IT AND DIVE DEEP TO FIND IT. BINANCE HAS ATLEAST 200+ GOOGLE OPTIMIZERS WHO REMOVES DUSTS AND VIDEOS FROM YOUTUBE.
There is a specific reason a bum from Tokyo sold his appartment and took over ALL the exchanges, not by beeing fair, only by stealing and scamming their way to the top. Yes Binance, that is the truth.
-----------------------------------------------------------------------------------------------------------------------------------------------------------------------------------------------------------------------------------------------------
TAKE CARE FELLOW TRADERS, TRADE YOUR COINS WITH A DEX EXCHANGE SO YOU ALWAYS KEEP YOUR FUNDS IN YOUR OWN WALLET. DO NOT TRUST ___ANY___ THIRD PART.

✅TS ❕ BCHUSD: rebound✅✅ BCHUSDT bounced back from the support level.
The chart is moving in an uptrend.
Price will continue to rise. ✅
🚀 BUY scenario: long to 134.5 🚀
----------------------------------------------------------------------------
Remember, there is no place for luck in trading - only strategy!
Thanks for the likes and comments.

BCHUSDT trend changed go to 150EMA shows us that the trend has changed and is going up.
The target is 150

BCH/USDT 1DAY UPDATE BY CRYPTO SANDERSHello, welcome to this BCH/USD update by CRYPTO SANDERS.
CHART ANALYSIS:-Bitcoin cash (BCH) was another notable gainer to start the week, as the token moved to a ten-day high.
BCH/USD hit a peak of $129.15 on Monday, a day after the price was trading at a low of $120.54.
This rally sent BCH to its strongest point since March 24, when it rose to a peak at $132.05.
Earlier gains have since slipped, as the RSI collided with a ceiling at the 51.00 mark. Currently, the index is tracking at 50.59, following a rally from a support point of 47.00.
Overall, bitcoin cash is now up 5.78% from the same point last week.
I have tried to bring the best possible outcome to this chart.
Hit the like button if you like it and share your charts in the comments section.
Thank you

#TOBTC #LQR #BCHBtcoin Cash is stuck on Daily Resistance 125.5 , if we have a good Break out it may reach 136 $

02 - BitcoinCash Next TargetPrice targets for Bitcoin Cash BCH are:
BCH/USDT short
Entry Range: $123,70
Price Target 1: $120,80
Price Target 2: $114,97
Price Target 3: $108,81
Stop Loss: $131,12

BCHUSDT Elliott Waves AnalysisHello friends.
Please support my work by clicking the LIKE button👍(If you liked). Also i will appreciate for ur activity. Thank you!
Everything on the chart.
Entry: market and lower (im in pos from 124.1)
Targets: 165 - 200 and maybe ~220
after first target reached move ur stop to breakeven
Stop: ~105 (depending of ur risk). ALWAYS follow ur RM .
RR: 1 to 6
risk is justified
Good luck everyone!
Follow me on TRADINGView, if you don't want to miss my next analysis or signals.
It's not financial advice.
Dont Forget, always make your own research before to trade my ideas!
Open to any questions and suggestions

✅TS ❕ BCHUSD: low volatility✅✅ BCH failed to break through the resistance level.
Volatility declined.
The asset may start to decline. ✅
🚀 SELL scenario: short to 128.8. 🚀
----------------------------------------------------------------------------
Remember, there is no place for luck in trading - only strategy!
Thanks for the likes and comments.

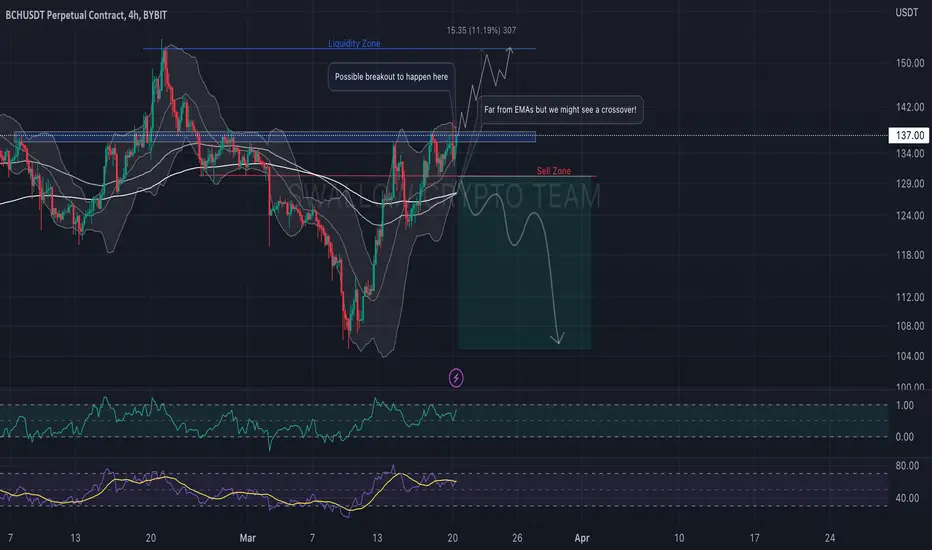
BCH/USDT possible movement Hey, traders ✌️
BCH/USDT pair is next on our watch list today. We see that price of this coin can see one more breakout attempt which can succeed but for how long? EMA zones are too far away and RSI with BB are both near overbought zones. Will be watching closely this one. Any thoughts guys?
If you like ideas provided by our team you can show us your support by liking and commenting.
Yours Sincerely,
Swallow Team 🔱
Disclamer:
We are not financial advisors. The content that we share on this website are for educational purposes and are our own personal opinions.
Bch Long term Analysis Descending channel Breakout Has already Confirmed Now Waiting For Now for More Safer Entry Waiting for range To breakout to the upside
Rsi Also Printed Massive Bullish Divergence Incase Of Range Upside breakout expecting Massive recovery In coming Weeks Or months
our expected targets 276 410 & 800
This Type higher Timeframe entries Have Low Risk With high Rewards
