One day analysis of BCHUSDTStill holding on to our support zone now, but the situation is getting harder, the global market keeps falling still caused by political tensions and any movement could lead the price to eventually break to the downside. Since the situation is highly unclear now, this could be a chance for cryptos. To some extent, Russia's organizations could use crypto to avoid the western economic transactions which would boost stable coins' trading volume
BCHUSDT trade ideas

BCHUSDT Market AnalysisAn expected rebound with an expected resistance above the head. so there could be two situations: the price will form a lower high just in the current candle then head down to break the support (260~270). or we will find a midpoint between the support and resistance which form a narrowed waving range 288~305 with low volume which I think would be more likely to happen, then try to conquer the resistance (305~315)

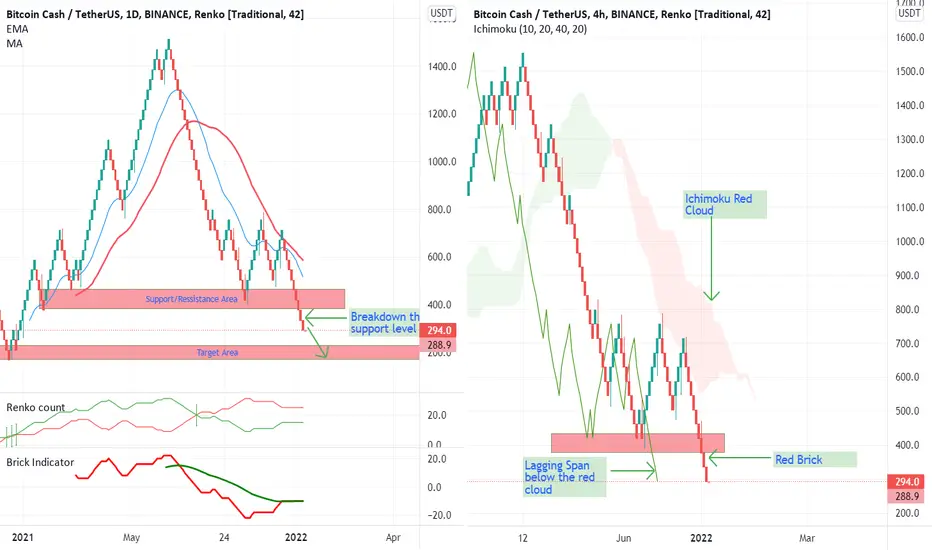
BCH broke down the support levelBCH broke down 400$ support level. Ichimoku analysis confirms the downtrend.(See chart on the left.) The target is around $ 190 COINBASE:BCHUSD BINANCE:BCHUSDT BITTREX:BCHUSDT
Analysis of BCHUSDTSeems like It's inevitable to test 260 again now. As we can see in the chart, the market keeps heading down and we barely see buying power. A big reason for the market fall should be the recent tension between Russia& Ukraine. Global stock indexes and U.S. futures fell. Futures on the Nasdaq-100 index stood 2.1% lower, while those for the S&P 500 dropped 1.4%, therefore cryptocurrencies come under pressure too. Yesterday was Presidents Day and this sell-up happened in the morning. In the near future, cryptos price would also be highly related to the political situation while the situation remains still unclear, the market is unlikely to have a positive turn.

Bitcoin Cash how to earn guaranteed x3On the chart, I put the line at number one, this is the line that would allow past investors to earn money guaranteed by waiting for the price equilibrium. The current equilibrium is on the line designated under number 2, buying now and waiting for the price to go to that point, we are guaranteed to make a profit. In this case, only delisting of the coin and nothing more can interfere

One day analysis of BCHUSDTThe chart doesn’t look good. But if we analyze the volume carefully, we will find out that the buying power actually didn’t fade too much, which means there’s a slowly continuously buy activity. Plus with this rebound, the price do stand above to MA50 which is another good signal.

Bitcoin cash seems to complete ABC correction.Ready for 3rd waveBitcoin cash has completed ABC zigzag correction.Wave A was very deep whereas the wave C was shallow and ended as an endng diagonal which also signifies end of downtrend.Price below 254 will invalidate the wave count.Seems like we will soon see big impulse wave 3 breaking all time high....

One day analysis of BCHUSDT312 proved itself as support again along with the buying power are not willing to let bears conquer this position at least for now. As long as the price stay above it. I'll be seeking for the long trade.

One day analysis of BCHUSDTThe price approaches the lower band of the uptrend now and we can spot fairly buy power on the I hour chart. Though better to wait and see if the 4-hour chart candle can close above it.

One day analysis of BCHUSDTBlitz Bull: both long-term and short-term charts show we are in the uptrend. So inevitably the market will need to overcome the previous double top thus leading a stable raise.
Blitz Bear: Since the 20th Jan's free fall now the rebound has gain back 2/3 in the peak time. If we fail to break 343 to the higher price then its likely a new round of downtrend will start.

BCHUSDT Analysis (perspective a couple of months)Hello friends.
Please support my work by clicking the LIKE button👍(If you liked). Also i will appreciate for ur activity. Thank you!
Everything on the chart.
Entry: market and lower
Target: 350 - 450 - 550
after first target reached move ur stop to breakeven
Stop: (depending of ur risk). ALWAYS follow ur RM .
risk is justified
Good luck everyone!
Follow me on TRADINGView, if you don't want to miss my next analysis or signals.
It's not financial advice.
Dont Forget, always make your own research before to trade my ideas!
Open to any questions and suggestions.

BCHUSDT Market AnalysisBuyers encountered pressure again in the previous high and this time the selling pressure seems to have worn up a bit. In this case, Our solid support and Upper-pressure level have narrowed the waving area Better to wait and see the market's choice of breaking direction

BCHUSDT Market AnalysisBlitz Bull: With the lower timeframe started entering an oversold zone, the market has cooled down for the downtrend, more importantly, the previous support is still solid so it’s likely we’ll have a reversal.
Blitz Bear: Since the double top, we have formed a lower high thus the next step would be breaking the previous low and creating a lower low.

BCH- Trend update (LONG)Hello trading friends,
This is a daily update for BCH with the trend expected for a long.
BCH looks slowly coming back into trend. and the question is this the bottom?
We know BCH as a coin that gets traded by the Asia market as most. - and it has its own long-term holders, where the dollar cost average places on it.
It's always good to wait for confirmations and to buy into the red.
Interesting levels for uptrend are 400 USD, and for long term 500 USD +.
Let's see how this coin will affect the coming time, and or BCH bottom is here.
Most of the coins waiting for BTC - so it's important also to follow BTC trends - and price changes take also time.
At all times manage your risk well and have a great day.
If you like this idea - leave a like and follow - Thank you
This is not a trading call.

BchHello dear traders
Entry:326_328
Stop:323
Tp:347
This is my personal strategy and you base your stop on your capital management and strategy.
Please write your comments to get a good view.
Good luck


BItcoin Cash Midterm Analysis📊 BCHUSDT (Bitcoin Cash )
💹 Time Frame: Daily (Update)
➖➖➖➖➖➖➖➖
🟡 BCH is now trading near the S/R area of 350$. BCH has already broken the trend line and holding it well. You can build your position in BCH near the 370$ _ 400$ area but . The first resistance is $620 area
and the major resistance is $700-$720 area. The next good support is 260$_ 300$ area.
⚠ Use proper stops in trades as the market may become Volatilein the coming days.
💎 This analysis will be updated
Amir Hossein
📅 02.11.2022
⚠️ (DYOR)

BCHUSDT 4H: Possible LONGBCHUSDT 4H: Possible LONG
The price bounced back from the level of 315 on the 4H chart. A potential price increase to 420 is indicated by this signal.

Bch long swing | BCHUSDT | LONG @ 334 - 338 | TP @ 340, 344, 348, 352, 356 | SL @ 304 | PATTERN = TRIPLE TOP BREAKOUT | BINANCE |
Swing trade idea. Kindly follow targets and stop loss. Will update with new targets once all 5 are achieved.


BCHUSDT Market AnalysisFrom the 4 hours chart we do found a valid double top, also there's a divergence after getting a red candle. Looking on the RSI, our first top was in the overbought scenario and our divergence does exists, with that being the case, as you can see market crashed after getting that double top at a major level of resistance. Also we need to find next potential level that could be a buy points where we can use the contrast of double top which is double bottom pattern. Now we are expecting the price heading back to 270 while with some small swings in the middle when forming that.

BCH/USDTBCH/USDT Binance 1h Chart Reached the resistance line ,
If Resistance Break Next Resistance Available,
If not Break Then Next Support Line Available,
