BCHUSDT SHORT IDEAhi everyone. today crypto market seems gonna pull back. so i saw that bchusdt almost losing its momentum and soon can decline with bitcoin to its orderblock. also usdt.d graphic on daily base on the very very powerfull resistance. it indicates crypto market can decline seriously. so we can try short setup :
entry : 361.8
stop : 374
target : 330
for more scalp positions and loss-profit situation of my positions feel free to follow me,
x.com/dogukancevikfzk
BCHUSDT trade ideas


BCH Long Position (Trend Breakout Retest)Market Context: BCH has broken out of the daily descending trend and is now retesting the breakout, creating an excellent opportunity for a long spot position.
Trade Setup:
Entry: Ladder into a long spot position between $350 - $365.
Take Profit:
First target: $430 - $460
Second target: $500 - $530
Stop Loss: Just below $330.
This setup leverages the retest of the breakout for a favorable risk-to-reward opportunity. #BCH #Crypto #Breakout

BCH, ready for another ROUND to the UPSIDE!BCH, has been consolidating at the 240ish range for a few days now. Price has been moving horizontally with thin volatility suggesting a firm support at the current levels.
It's currently at the 38.6 FIB level -- a first level support for buyers.
On Daily histogram (top indicator), it has recorded its first bottom-wave shift line after almost 7 weeks. Last one was on June 13. This bottom-wave shifting line usually appear as a prerequisite before a surge in prices. New bubble up volume has appeared after almost two weeks suggesting firm support of buyers at the present range.
Daily higher lows has been created -- with first white light candle in sight.
On monthly data, it has recorded it's 2nd net positive volume increase signifying a firm support on the intended goal direction: UPSIDE.
Expect some significant price ascend from here on.
Spotted at 248.0
TAYOR.
Safeguard capital always.

BCH ANALYSIS📊 #BCH Analysis
✅There is a formation of Falling Wedge Pattern on daily chart with a good breakout and currently retesting the major resistance zone🧐
Pattern signals potential bullish movement incoming after a breakout of major resistance zone
👀Current Price: $356.8
🚀 Target Price: $435
⚡️What to do ?
👀Keep an eye on #BCH price action and volume. We can trade according to the chart and make some profits⚡️⚡️
#BCH #Cryptocurrency #TechnicalAnalysis #DYOR


BCHUSDTThis trade is based on a bearish outlook for BCHUSDT, with signs pointing towards a potential downside movement. I'm expecting price action to move lower, targeting key levels for a profitable exit. Entry, Take Profit, and Stop Loss levels are clearly defined on the chart, allowing for a well-structured risk management approach. The trade plan anticipates further weakness, offering a solid short opportunity while keeping risk in check.

BITCOIN CASH📊 #BCHUSDT
⏱ TIME: 1D
📝The price is in a wedge, and if the upward wave breaks, the price will see higher targets, but if the price reverses, we can wait for support (purple box) to be seen
⭕️risk: mid

BCHUSDT LONG
local double bottom on the daily, easy to manage risk here. signs of accumulation. Also showing hidden bullish divergence on the daily. stop below 302 3 target trade.

#BCH/USDT breaks the diagonal trendline and holds it above it in#BCH/USDT breaks the diagonal trendline and holds it above it in 1-hour TF!
SET:BCH local support level is PDH $323.15, and the resistance level is PWL $336. Expecting a bounce from here.

Bitcoin Cash Short-Term (Boom, Bust & Reset)Bitcoin Cash is trading daily below EMA377, coming from a new high; this last happened in December 2021, so this is a major development, a bearish one.
A major resistance range is set around 330 - 350. If BCHUSDT is trading below this range, we consider it ultra-bearish (if it moves above it becomes bullish).
Bitcoin cash is currently trading at 315, which is below the above mentioned range. We have the same pattern of lower lows and lower highs as the other pairs and a strong short-term bearish tendency.
Let's get to the point, the correction is likely not over, we have more downside before it ends. The lower highs dynamics and continued selling pressure can lead to a lower low. The potential targets for this low is mapped on the chart.
After the low is in, we should experience some sideways action (consolidation) followed by a recovery. It will take time before we are fully bullish again. Each cycles goes through a boom and after the boom comes a bust and after the bust comes a reset, the reset is the consolidation phase.
Namaste.

Bitcoin Cash Analysis BCHIt is the result of reading the price pattern and considering the volume behavior.
Found that bitcoin cash is in the middle of a bear correction.
This could be wrong
MD

BCHUSDT: Broke out, ready to go!!Join our community and start your crypto journey today for:
In-depth market analysis
Accurate trade setups
Early access to trending altcoins
Life-changing profit potential
Let's analyse BCHUSDT both fundamentally and technically.
FUNDAMENTAL ANALYSIS:
Bitcoin Cash (BCH) is a cryptocurrency that split from Bitcoin (BTC) in August 2017. It was created to address Bitcoin's scalability issues, featuring larger block sizes (initially 8 MB) for faster and cheaper transactions. BCH aims to be a practical digital cash for everyday use, emphasizing low fees and quick processing. The BCH community continues to develop and improve the network.
TECHNICAL ANALYSIS:
BCHUSDT has exhibited a significant price movement. After a prolonged period of trading within a symmetrical triangle pattern, the price has successfully broken out. This breakout is supported by an RSI volume breakout, indicating a potential bullish trend. Additionally, a substantial increase in 24-hour volume suggests growing interest and potential upward momentum.
Buying Levels:
CMP to $339.7
Target Levels:
Hold for 2x-3x in long term.
If you find this analysis helpful, please hit the like button to support my content! Share your thoughts in the comments and feel free to request any specific chart analysis you’d like to see.
Happy Trading!!

Bchusdt trading opportunityBCHUSDT is displaying a potential rounding bottom formation, suggesting the formation of a cup and handle pattern upon price testing the neckline area. Our plan involves accumulating the coin towards the immediate buyback zone while focusing on the crucial demand level, currently acting as significant support.
The rounding bottom neckline is identified as a potential sell-off area, marking the beginning of a correction for the handle formation.
Subsequently, breaking above the neckline will confirm the final setup target, as indicated on the chart.
We welcome your feedback on our analysis. Your comments and likes are highly valued and appreciated.

#BCH/USDT#BCH
The price is moving in a descending channel on the 12-hour frame and is sticking to it greatly and is about to break upwards
We have a bounce from the lower limit of the channel, price 294
We have an upward trend on the RSI indicator about to break, which supports the rise
We have a trend to stabilize above the moving average 100
Entry price 326
First target 387
Second target 444
Third target 514

BCHUSDT - SHORT [Daily Signal]With each signal of movement for the dominant BTC, it is logical to expect movement in the same direction of the rest of the coins (with rare exceptions).
Circles mean what they mean, you know.
Stay tuned.

$BCH Long SetupEntry & Exit target in Chart SET:BCH
Bitcoin Cash (BCH) has a future. It is forecasted to grow, supported by its scalability and lower transaction fees. Continued development and adoption, coupled with advancements in technology and integration, are key to BCH's long-term success and potential value increases to potentially hit and exceed $1,000.

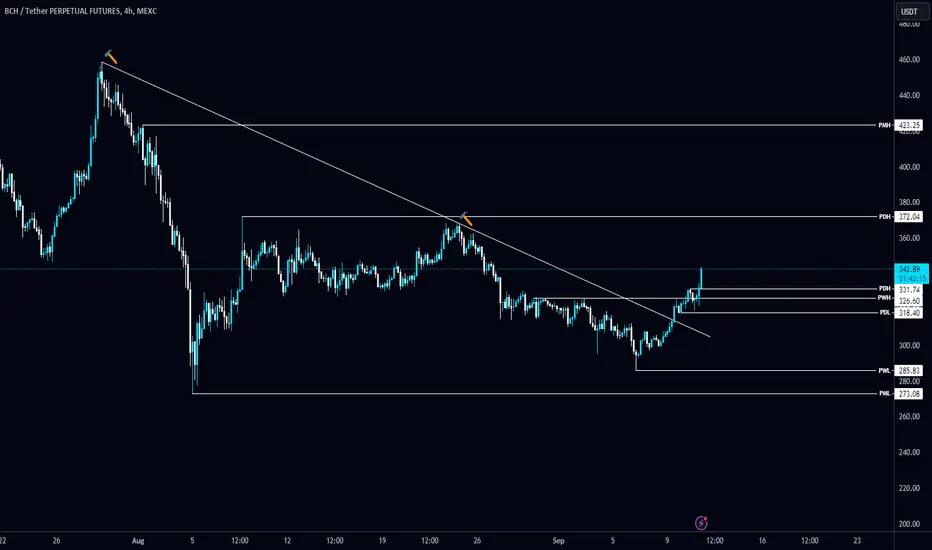
#BCH/USDT breaks the Diagonal Trendline in 4-hour TF!#BCH/USDT breaks the Diagonal Trendline in 4-hour TF!
SET:BCH retested the PWL $326 support level and bounced hard. The local resistance level is PDH $372.
#BCH Technical Analysis in a Daily TimeframeHello everyone, I’m Cryptorphic.
I’ve been sharing insightful charts and analysis for the past seven years.
Follow me for:
~ Unbiased analyses on trending altcoins.
~ Identifying altcoins with 10x-50x potential.
~ Futures trade setups.
~ Daily updates on Bitcoin and Ethereum.
~ High time frame (HTF) market bottom and top calls.
~ Short-term market movements.
~ Charts supported by critical fundamentals.
Now, let’s dive into this chart analysis:
BCH has rebounded from the support we mentioned in our previous video. The price is currently approaching the resistance trendline and the 50 EMA, which ranges between $345 and $363.
BCH needs to break out and close above this resistance level to remain bullish. A rejection will likely push the price down to the lower channel.
Key levels:
- Primary Resistance: $345-$363.
- Primary Support: $292.
- Lower Support/Decent Accumulation: $228.
- Targets: $444, $520, $616, $720.
DYOR, NFA.
Please hit the like button to support my content and share your thoughts in the comment section. Feel free to request any chart analysis you’d like to see!
Thank you!
#PEACE

Bchusdt spot buyThis is clearly an opportunity to open a long position. You can't see it right now for psychological reasons. I don't recommend futures leverage. Spot buy and hold target 509

Bchusdt longWhen I looked at btcusdt, I saw that it was below the 3-month average and similar to the past graphic wave structure. And I indicated the target position direction and the levels you may need on the graphic. Now it's time to play

BCH/USDT PLAN The symmetrical triangle pattern forming on the daily chart for BCH/USDT suggests a potential upcoming breakout. Buyers appear to be gaining interest, indicating a potential bullish move in the short term once the breakout occurs. However, trading patterns are complex, and outcomes are never guaranteed. It's always important to conduct thorough research and analysis to make informed trading decisions. Keep an eye on the chart for confirmation of the breakout before considering any trading actions.

BCHUSDT Bullish Reversal Signals BCHUSDT is currently trading at $338.6, and several technical indicators suggest a bullish reversal is on the horizon, making this a prime buying opportunity. The Relative Strength Index (RSI) is currently above 60, indicating strong bullish momentum. Additionally, the Moving Average Convergence Divergence (MACD) line has crossed above the signal line, which is a classic buy signal, suggesting an increase in buying pressure.
Furthermore, the price has recently bounced off a strong support zone at $335, which has historically acted as a significant floor for BCHUSDT. This level has been tested multiple times and has consistently held, indicating that the market has likely found a bottom. The presence of a bullish hammer candlestick pattern at this support level further reinforces the likelihood of an upward reversal.
The 50-day Moving Average is trending upwards and is approaching the 200-day Moving Average, setting up a potential golden cross. This pattern is widely regarded as a bullish indicator and could attract more buyers into the market. Moreover, the Fibonacci retracement levels show that BCHUSDT is holding above the 61.8% retracement level from its previous swing low, which is another positive sign.
Volume analysis also supports a bullish outlook, with increasing buying volume around the current price level, suggesting accumulation by traders. This increase in volume typically precedes a price rise as demand begins to outstrip supply.
Given these indicators, the current price of $338.6 presents a compelling entry point for traders looking to capitalize on a medium-term bullish move. Investors should consider accumulating BCHUSDT at this level and holding in anticipation of a significant price rise. A return to the $380-$400 range appears plausible, given the technical setup and historical price action. This confluence of signals makes the current market conditions an opportune moment to buy, with the potential for substantial gains as the market sentiment shifts towards bullishness.
