Oil Outlook: Rising Tensions versus Saudi Price CutsConflicting Factors Cause Volatile Start to the Year
The global oil market faces a turbulent start to 2024, navigating a complex interplay of factors that have sent prices on a rollercoaster ride. Saudi Arabia's unexpected price cuts, causing a nearly 4% drop in Brent crude on January 8th, hinted at the world's largest oil exporter's commitment to maintaining market share.
Just days later, Houthi threats, coupled with US and UK military strikes in Yemen, briefly pushed oil prices above $80 a barrel on January 12th. The redirection of oil tankers from the Red Sea intensified uncertainty, challenging earlier assumptions about market stability.
Analysts are divided on the medium-term trajectory of oil prices. While some focus on softening global demand and robust US supply growth, attributing the decline since September, others underscore the geopolitical landscape's role in swiftly altering market dynamics. The recent surge, driven by Houthi threats, highlights the delicate balance between global forces and market sentiment.
Technical Backdrop: Wedge Starts to Form
In the midst of conflicting market forces, technical analysis emerges as a crucial tool to contextualise January's volatility.
The daily candle chart for Brent crude reveals a persistent downtrend, with prices remaining over 18% below their September highs. Anchored volume-weighted average prices (VWAPs) from the autumn swing highs act as dynamic resistance points as the trend continues downward.
However, having retested key support in December, we have seen prices start to carve out a small series of higher swing lows – ‘funnelling’ the market into a ‘wedge’ pattern.
We can use this consolidation pattern as a canary in the coal mine – a decisive break above the wedge could set the stage for change in trend while a break below could finally trigger long-held support to be breached.
Brent Crude Daily Candle Chart
Past performance is not a reliable indicator of future results
Disclaimer: This is for information and learning purposes only. The information provided does not constitute investment advice nor take into account the individual financial circumstances or objectives of any investor. Any information that may be provided relating to past performance is not a reliable indicator of future results or performance. Social media channels are not relevant for UK residents.
Spread bets and CFDs are complex instruments and come with a high risk of losing money rapidly due to leverage. 75% of retail investor accounts lose money when trading spread bets and CFDs with this provider. You should consider whether you understand how spread bets and CFDs work and whether you can afford to take the high risk of losing your money.
BCOUSD trade ideas

BRENT Head and Shoulders forming?This could be good deal if it come true and pattern is fully formed

Brent Cash 15/1/2024The entry, exit and stop loss points are on the chart, please make sure of them and do not risk, this is our analysis and ideas.
Please observe the capital carefully and do not risk more than 1% of your capital
Good luck to everyone

OIL - 4hDue to the inability to break the resistance of 81.5 points upwards, if the upward trend of the price breaks down and the price stabilizes below the range of 78.0 units, there is a possibility of the price falling to the range of 76.8 units and in case of strength, there is a range of 75.0 units.
Otherwise, the possibility of price increase up to the range of 81.5 units.

DeGRAM | UKOIL selling opportunityUKOIL has been making lower highs and lower lows.
Price broke and closed below the psychological level of 80.00.
We anticipate a trend continuation and a retest of the support level.
-------------------
Share your opinion in the comments, and support the idea with a like. Thanks for your support!

UKOil Bullish**Yearly Chart**
UKOil (Brent) last year's candle closed in a big range between 70 and 95 levels. While the intermediate trend suggests continuing the long-directional bias.
**Monthly Chart**
After retracing from an all-time high at around 125 level in 2022. The price retraced back to balance the move at 50% of the swing high and then remains in a range from March 2023. As far as the price does not break the swing low at around 70 (key level), I am expecting the bullish momentum to continue this year.
**Weekly Chart**
Last week candle closed as a doji candle which is an indication of indecision in the market. I would like to see the price retrace slightly lower, provides a reversal, and then move higher in the coming weeks.
**Daily Chart**
I would like to see the price tape into the demand zone and provide a confirmation to go higher.

Brent (ICE) may rise to 81.00 - 81.40Pivot
79.30
Our preference
Long positions above 79.30 with targets at 81.00 & 81.40 in extension.
Alternative scenario
Below 79.30 look for further downside with 78.60 & 78.00 as targets.
Comment
The break above 79.30 is a positive signal that has opened a path to 81.00.
Supports and resistances
82.10
81.40
81.00
80.19 Last
79.30
78.60
78.00
Number of asterisks represents the strength of support and resistance levels.

Brent above 200$ scenaerioLooking at multi year blue wedge brent could perform a massive bull move 1st target 213$
2nd tp (less likely) 260$

Brent Cash UP TO 81.46$The entry, exit and stop loss points are on the chart, please make sure of them and do not risk, this is our analysis and ideas.
Please observe the capital carefully and do not risk more than 1% of your capital
Good luck to everyone

Crude Oil Bullish Crude oil bullish Scenario
After breakout and retest will be great long opportunity.

Brent - W1\D1Brent
W1 - The price may form a potential 3-wave structure, which, if wave 1 is broken, will mean continued upward movement to the values of 95.90
D1 - You can observe the formation of a triangular structure with a breakout of the upper trend line. Globally, the levels that the price can reach are 92.04
What can you expect?
You can consider entering from the current levels of ~79.21 or wait for the price to fix behind the trend line and then consider entering.
Cancel if the price breaks the minimum - 75.34, if you are considering the entry from W1 and the formation of a 3-wave structure, the stop can be set at the minimum of the 1st wave at 72.00
Long
Target 81.41 - 82.78 - 85.51 - 87.98 - 92.04

Brent (ICE) may rise to 77.70 - 78.15Pivot
76.80
Our preference
Long positions above 76.80 with targets at 77.70 & 78.15 in extension.
Alternative scenario
Below 76.80 look for further downside with 76.45 & 75.95 as targets.
Comment
The RSI calls for a rebound.
Supports and resistances
78.70
78.15
77.70
77.35 Last
76.80
76.45
75.95
Number of asterisks represents the strength of support and resistance levels.

Diagonal leading?? Three corrective waves and then a fallDear FRIEND,
I hope you're doing well and that the new year has started on a good note for you. I wish you success in your business endeavors and a happy new year with your loved ones.
As someone interested in the Elliott Wave principle, I find it to be a valuable tool for market analysis. I have developed my approach by combining this principle with my personal experience and by considering various scenarios that are likely to occur in the market.
I am sharing my analysis with you. However, please note that I am not providing any buy or sell signals. My goal is to share my unbiased analysis with you so that you can use it as a guide to make informed decisions.
In the attachment, I have included my previous analysis of the same market so that you can compare and see the. All the details of my analysis are clearly labeled, making it easy for you to understand (although having a basic familiarity with the Elliott Wave Principle theory will help you understand the analytical idea more easily).
I have been studying the Elliott Wave principle for almost three years now. With time, my understanding of this knowledge and experience has increased. What I have achieved so far is a legacy of a genius named Ralph Nelson Elliott, and I am truly satisfied with my progress. May his soul rest in peace and his memory be cherished.
Thank you for your support so far. I am grateful and will always remember your kindness. Please feel free to share your thoughts and feedback with me.
I hope my analysis will be useful to you in your business journey, and I wish you all the best.
Sincerely,
(Mr. Nobody)
BRENT OIL USD - Short SellIts Break the Potential Reversal Zone and now moving Forward, After Some down its made its Correction and then its will go Up and Made Bullish flag it there is no Divergence.
Enjoy Profit and Don't follow me or Hired me😁

BRENT CRUDE DAILY CHARTBRENT CRUDE DAILY CHART
Ellipse breakdown @ 72.500 MOB @ 63-60
Crude has witnessed a breakdown @ 82.955 marked by orange ellipse & hit target @ 72.871 as marked by red ellipse.
A break below red ellipse will open MOB @ 63-60 levels.
Its only an observation & not any suggestion or recommendation.

BRNUSD_4HMid-term Brent oil analysis
There is a possibility that the market will enter an upward ABC correction wave
The main support range is $75,000
The target range is $84,000

DeGRAM | UKOIL channel breakingUKOIL rebounded from the support level.
Price decelerated while approaching the support level.
The market has reached a significant level on the daily chart, so it makes sense to buy the market.
We expect a bullish move to potentially break out of the descending channel.
-------------------
Share your opinion in the comments and support the idea with like. Thanks for your support!

Brent, dailyTA normally considers a trend to be active until there’s evidence that it has ended, so further losses seem to be possible for oil in the medium term. However, the price recently made a higher low and doesn’t show any sign of buying or selling saturation. The main dynamic resistance in the short term which might cap gains is the 50 SMA around $80, also a psychological area. A logical first target to the downside in the medium term would be around $72.50. Movement at the end of the week is likely to depend on the dollar’s reaction to the job report.

Crude oil - $200 per barrelWe've all seen how oil reacted to the beginning of the Israeli-Palestinian conflict. I am sure that this conflict will not settle down quickly and will only increase. The conflict will involve other players in the region - Emen is proof of this fact.
How will oil react to this?
The suspension of supplies and other problems with oil supplies will provoke demand for oil and the price will go higher and in the next few years will renew historical highs up to $200 per barrel. I think this was calculated by the coalition of aggressor countries before the war started.
about TA
We see a strong horizontal level where there is a lot of liquidity (concentration of stop losses) which will be collected up to the level of the largest horizontal volumes from below. And only after that, we will see a global reversal, which is probably the end of the year - December
On the chart, I have shown levels from which I will try to take longs.
I hope there will be PEACE in the world.
Our world looks very humongous in terms of cosmic civilization sending tons of bombs to kill each other.
Best regards EXCAVO

Uk Oil good support return to around $100Uk Oil good support return to around $100.
oil can hold support, so return to $100 as FED hold interest rate un change.

Brent (ICE) may fall to 74.70 - 75.10Pivot
76.90
Our preference
Short positions below 76.90 with targets at 75.10 & 74.70 in extension.
Alternative scenario
Above 76.90 look for further upside with 77.60 & 78.20 as targets.
Comment
As long as 76.90 is resistance, likely decline to 75.10.
Supports and resistances
78.20
77.60
76.90
75.81 Last
75.10
74.70
74.00
Number of asterisks represents the strength of support and resistance levels.

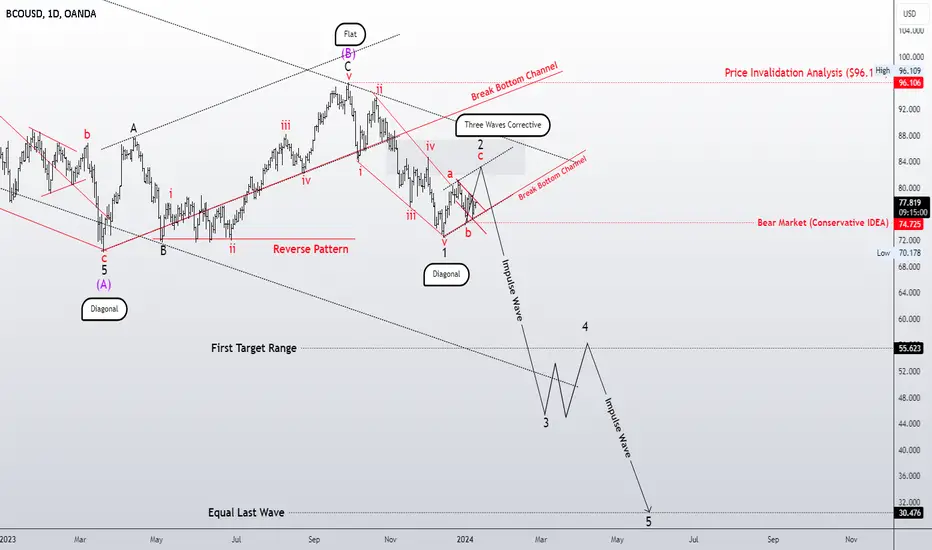
Leading Diagonal, Now Three Waves Corrective??Hello there,
I hope you're having a great start to the new year. I wish you all the best in your trading ventures and a happy new year with your loved ones.
I'm a fan of the Elliott wave principle, which I find interesting and useful for market analysis. I've developed my analytical approach by combining this principle with my personal experience and considering various scenarios that are likely to occur in the market.
Although I'm going to share my analysis with you, please note that I won't be providing a buy or sell signal. My goal is to share my unbiased analysis so that you can use it as a guide to make an informed decision.
To give you confidence in my analysis, I'll always share my previous analysis from the same market so that you can compare. All the details of my analysis are clearly labeled, making it easy for you to understand.
I hope my analysis will be useful to you in your business journey, and I wish you the best.
I'm waiting to hear from you. Finally, I'd like to remind you that like-mindedness and support, comments, and likes are the most important pillars of progress, like support points in the financial markets. They give me the energy to continue and share more ideas with you.
Sincerely,

Brent Oil - 4HIn the four-hour time frame, due to the slowing down of the upward movement momentum of the price and the decrease in the strength of the buying pressure, if the range of 79.0 units is broken downwards and the price leaves the upward trend, there is a possibility of the price falling to the range of 77.7 and in the case of the strength of the range of 76.0 units.
Otherwise, the possibility of price increase up to the range of 82.5 units.
