$AMD breaking out!$AMD. Could fly along with the NVDA flying new highs.
Could possibly fill the gap above.
AMD trade ideas

Levels to manage $AMD while waiting for its MI350 and MI390Copy & Paste from Morgan Stanley's note:
Can MI350 be the Rome of AI? Yes, it's possible. The company's scramble to add AI engineers through two transactions is actually a good sign. While bears see it as an indication of a software ecosystem that is behind the competition, we thought that anyway, and the company making an aggressive push to turn that around quickly rather than accepting an immature position and fixing it a little bit at a time is certainly a positive. AMD executes very well, having never meaningfully missing a product launch target in the Lisa Su era, which we find exceptional. And unlike the initial server ramp, Instinct will benefit from being directly tied to the server CPUs that are becoming dominant in cloud- which gives them leverage to at least build a ubiquitous presence across multiple clouds.
AMD opened the product announcements with the launch of their 5th gen EPYC server processor (Turin), which should build on their leading position with cloud customers. Gen 5 is platform compatible with AMD's zen 4 lineup and will feature two primary product families, one more enterprise focused "scale up" set of 4nm skews and cloud focused "scale out" 3nm versions where the high end 192 core product offers 2.7x performance vs 64 core Emerald Rapids from Intel (launched late last year) on an industry standard integer score benchmark. With AMD highlighting leading performance vs Intel in other areas including ML and AI workloads. Both families of zen 5 utilize a 6mn IO die. Representatives from google cloud, and Oracle Cloud were on stage with positive endorsements for the new products.
Advanced Micro Devices | AMD Team RED is READY
As with any competitor, a quarterly earnings report from a peer can provide great insight into the market. For Advanced Micro Devices, the Q2'23 earnings report from Intel provides great views on the surging demand for AI chips and a rebound in PC demand crucial for AMD
The most immediate signal from Intel beating Q2'23 estimates and guiding up for Q3 is the rebound in PC demand. Most importantly, the inventory correction appears over with OEMs no longer digesting chip inventory.Back in Q3'22, AMD shocked the market by cutting PC revenue estimates by $1 billion. The company quickly went from $2 billion in quarterly CPU sales for PCs to less than $1 billion.
Intel still reported Q2 Client Computing revenue was down 12% YoY to $6.8 billion, but the number was up $1.0 billion sequentially. The chip giant guided up Q3 revenue to $13.4 billion, up $0.5 billion sequentially.In Q1'23, AMD reported that client revenues had fallen further to only $739 million. AMD CPU revenues are now far over $1 billion per quarter below the peak levels providing substantial upside potential when the PC market normalizes.
Intel discussed a mixed picture for their business in the near term due to AI. The chip giant is seeing a wallet share shift from the sever CPU spend towards AI chips.The move is both good and bad for AMD. The company has the MI300 AI GPU chip hitting the market in Q4 providing a strong competitor to the booming demand for the H100 from Nvidia, but the chip isn't out on the market yet.
In the near term, AMD may see some suppressed data center demand while heading into 2024. Ultimately, the company should see upside from AI demand for the MI300 along with the Alveo AI accelerator.On the Q2'23 earnings call, Intel CEO Pat Gelsinger suggested the AI pipeline for 2024 had surged to $1 billion: In my formal remarks, we said we now have over $1 billion of pipeline, 6x in the last quarter.
Going back a few months, Morgan Stanley had estimated the AI potential for AMD was only $400 million with upside potential to $1.2 billion. The Intel forecasts would suggest the AI potential for AMD is far higher next year when the MI300 is in full-scale production.
Nvidia guided up current quarter sales estimates by 50% to over $11 billion. The company suggested data center sales would reach $7+ billion in the quarter.
AMD has only seen data center sales reach $1.3 billion in quarterly sales leaving a huge gap from Nvidia. Even Intel still hit $4.0 billion in data center sales during Q2'23, though the amount is down nearly 20% form 2022 levels due in part to losing market share to AMD.
The big issue for AMD is whether data center sales growth stalls causing a miss to 2H sales targets while booming AI demand ultimately boosts sales starting in Q1'24, or maybe Q4. The chip company peaked at quarterly sales of $6.6 billion back Q2'22 and the current quarterly analyst estimates aren't very aggressive.
A rebound in PC demand to more normalized levels places AMD back at the Q4'23 revenue target of $6.5 billion alone. A PC rebound to normal digestion ($2 billion quarterly run rate) along with higher data center or AI demand leads to vastly higher revenues in 2024.
The current analysts aren't even factoring in much growth in the Q2'24 revenue estimate of $6.76 billion. The amount is just 4% upside from Q2'22 despite potentially surging demand from AMD entering the AI GPU space.
AMD is set to report earrings after the close on August 1. Investors should focus less on the Q2 numbers or even Q3 guidance and focus more on a return to more normalized revenue levels plus the upside from AI.Our view has long held that AMD has the earnings potential of $5 to $6 and the AI opportunity is all upside to this view.
The key investor takeaway is that AMD is still $50 below all time highs while Nvidia has soared over $100 above the late 2021 highs. Investors should use the current weakness in AMD to load up on the stock while leaving some capital to buy any weakness following Q2 earnings due to the potential for near term disappointment leading to long term opportunities.

still a sell to 150 all indicators pointing in one directionWith the channel approaching support and other indicators seeing a continuing pattern to the support line, it may pick back up after 140s.

AMD (Advanced Micro Devices, Inc.) BUY TF D1 TP = 184.94On the D1 chart the trend started on Aug.8 (linear regression channel).
There is a high probability of profit taking. Possible take profit level is 184.94
This level, which I have outlined above, is certainly not a “finish” level. But it is the level that has the “highest percentage of hits on target.”
Using a trailing stop is also a good idea!
Please leave your feedback, your opinion. I am very interested in it. Thank you!
Good luck!
Regards, WeBelievelnTrading

AMD LONG TERM TARGETSConsidering that AMD will be the next competitor to NVDA, particularly in the area of servers and mainly with consumers of consoles with integrated artificial intelligence, these are my targets and accumulations for AMD in the long term
Market Position
Data Centers and AI
Financial Performance
Revenue Growth
Profitability
Technology and Innovation
Zen Architecture
Integration of Xilinx
Challenges and Risks
Supply Chain Issues
Competitive Pressure
Economic Factors
Growth Potential
AI and Machine Learning
Cloud Computing and Data Centers
Gaming Industry

AMD on the Weekly has a bullish MACD signal ready to RISE!The weekly MACD for AMD has generated a signal with bullish momentum up

140 clear path with number of areas to consider, bearish moveI have been watching closely; stochastics need to come down reversal indicators on the Heinkin MACD death cross, a slow-down correction.

AMD Wedge forming - Trade ideaAMD$ Nice consolidation. Could break soon. Trade idea on both sides.
***NOT A FINANCIAL ADVICE ***
AMD breaking outhi traders
The price created the downsloping channel and we are getting the breakout right now. The breakout is just happening so the long position can be taken now at 165$.
We are expecting the uptrend to continue.
The technical target for this formation is at 225$ which is corresponding with the previous ATH.
The higher low shown on the chart confirms our bullish bias therefore we don't expect this breakout to turn into the fakeout.
Stop loss: 132$
Good luck

AMDReclaiming 168.55 we can see a run up for earnings. Otherwise if we pull back before earnings I would be long.

$AMD will just start a rally!!!
AMD is moving in a bullish channel, and just has retested the previous downtrend line.
The green candle of yesterday signals that the price is supported, and will start to go bullish!
as far as i'm concerned, I will place my buy order at this area.

$AMD will just start a rally!!!
AMD is moving in a bullish channel, and just has retested the previous downtrend line.
The green candle of yesterday signals that the price is supported, and will start to go bullish!
as far as i'm concerned, I will place my buy order at this area.

AMD Massive Run ImminentAMD's 20-day SMA is about to cross below its 50-day SMA. This might be viewed in a vacuum as bearish and when AMD has been trading below its 20-day when this crossover occurs, it has led to lower prices and a continued downward trend. However the few times it was trading above both averages when the cross over occurred, the stock went on huge runs including a 150% run and an 80% run.
My guess is this will play out like it has historically barring a general market debacle. Long AMD.

AMD: 4H Golden Cross is the best buy signal you can get.Advanced Micro Devices may be having a noticeable correction that turned the stock back to neutral both on the 4H and 1D technical outlook (RSI = 54.728, MACD = 5.610, ADX = 40.223) but it just formed the strongest bullish pattern of all: a Golden Cross on the 4H chart. In the past 2 years we've been given another two 4H Golden Crosses and both turned out to be the utmost bullish validation for enormous rallies, which in both cases extended at +141% from the bottom. We expect another such run and now we have the best confirmation (TP = 290.00).
## If you like our free content follow our profile to get more daily ideas. ##
## Comments and likes are greatly appreciated. ##

80% gains AMD/NVDA Pairs Trade: Best Level to BUY/HOLD AMD🔸Hello traders, today let's review 4hour price chart for AMD.
Price structure is bullish inverted H*S setup with reload zone bulls
near 150 usd, currently expecting rejection near overhead resistance.
🔸AMD is trailing behind NVDA so far this year, YTD gains of 17%, NVDA
YTD gains at 167%. AMD is trailing behind NVDA massively and expecting
mean reversion / catch up trade later in 2025. AMD market cap sits
at 250 bln USD so it's an easy double from here. Fair value for AMD
is 500 bln USD, NVDA is valued at 3 T right now, which is massive.
🔸Recommended strategy bulls: Bulls wait for rejection from overhead resistance to confirm IHS setup / near 175 usd and wait for pullback/correction into mirror S/R level at 150/155 USD. BUY/HOLD setup, SL fixed at 125 USD TP1 is 250 USD TP2 is 300 USD in 2025. This is a swing trade setup with 80%+ upside potential, naturally more patience required to hit targets.
🎁Please hit the like button and
🎁Leave a comment to support our team!
RISK DISCLAIMER:
Trading Futures , Forex, CFDs and Stocks involves a risk of loss.
Please consider carefully if such trading is appropriate for you.
Past performance is not indicative of future results.
Always limit your leverage and use tight stop loss.

AMD breakout possible buy opportunity#AMD #NASDAQ
break above flag pattern, potential heading higher towards 225 area as long it can stay above 162 area. If drop below 162, be careful.
(My personal opinion, not financial advise)

Top 5 Weekly Trade Ideas #5 - AMD BreakoutNVDA has been on a big run after its triangle breakout and doesn't seem to be slowing down yet. AMD has been on a run of its own and just broke out of the downtrend that started in March at ATH. It has also already came back for a retest and held.
First target will be the previous high from July around 187. Second target is near ATH around 215. A rejection and fakeout wouldn't be a good look, but it still has to go all the way back down below 133ish and make a lower low to be considered long term bearish.

AMD set to gain I'm eagerly anticipating AMD's Advancing AI Event. If the event reveals any information that could spark investor interest, I'll be purchasing the stock with a target price of $230. Any gains beyond that will be a bonus.

AMD - 4h - RSI DivergenceAMD Shares Alert: Potential Decline or Fakeout?
Advanced Micro Devices Inc. (NASDAQ: AMD) could see its shares drop to $150.00, with a divergence on the Relative Strength Index (RSI) suggesting a decline.
However, this could also be a potential fakeout from the asymmetric triangle pattern recently detected.
Keep an eye on this critical support level!

AMD broke above the Lower Highs and confirms a massive rally.It's been a while (August 13, see chart below) since we last looked into the Advanced Micro Devices (AMD), which was a strong long-term buy signal, with the price reacting very favorably, having already started its new Bullish Leg:
Today we take it to the 1D time-frame where where the scale of where the price might be compared to the previous two mega rallies since the October 13 2023 bottom, may be clearer. Remarkably, the last two rallies were both of around +142%. In symmetrical terms we are around the 0.618 Fibonacci level mark where both Bullish Legs had a technical pull-back.
The key bullish development of last week though has been the break above the Lower Highs trend-line, which in line with previous Legs, has been the confirmation of the start of the long-term rally. As a result, we have now validated that the Bearish Leg is behind us and any pull-backs this structure gives, will be buy opportunities.
Our Target is intact at $295.00.
-------------------------------------------------------------------------------
** Please LIKE 👍, FOLLOW ✅, SHARE 🙌 and COMMENT ✍ if you enjoy this idea! Also share your ideas and charts in the comments section below! This is best way to keep it relevant, support us, keep the content here free and allow the idea to reach as many people as possible. **
-------------------------------------------------------------------------------
💸💸💸💸💸💸
👇 👇 👇 👇 👇 👇

Bulls Eye AMD: Key Breakout Levels Ahead**Brief News Update:**
AMD will host the "Advancing AI" event on October 10, 2024, where it will unveil its latest Instinct MI325X AI accelerators and 5th generation EPYC processors. These products target high-performance computing and AI applications, with the MI325X offering up to 288 GB HBM3E VRAM and 6 TB/s bandwidth. Updates for the Ryzen AI PRO 300 series chips are also expected, potentially hinting at future line-ups like Strix Halo. The event will be streamed live via AMD's website and YouTube channel. AMD is expected to announce its quarterly earnings on October 29, 2024.
**Monthly Timeframe Analysis**
Five months ago*, I highlighted the Scallop formation, which has since broken out to the downside. However, the bulls managed to push the price back into the Scallop zone, as the closing price consistently remained within the range. This suggests that the bulls are keen on keeping the price above $140. The last two white bullish candles indicate a strong move, and my DTMI indicator points to a potential trend reversal. However, keep in mind that the white dot is on a still-open candle, so it is not yet confirmed. The #stoch RSI indicates there is still room for upward movement.
**Weekly Timeframe Analysis**
Looking more closely at the regular candles, while the broader picture suggests room for further upside, the trend needs to break first. We see a lower high (LH) and a lower low (LL) printed. The $187.28 level needs to be broken to look higher. If this doesn't happen, we may print another lower high (LH), and the previous low will likely be tested again, with a possible drop toward the psychological level of $100. It's crucial to monitor the market #structure closely, as the breakout of the resistance line occurred without above-average volume. This may mean the volume is yet to come, perhaps with the event on October 10.
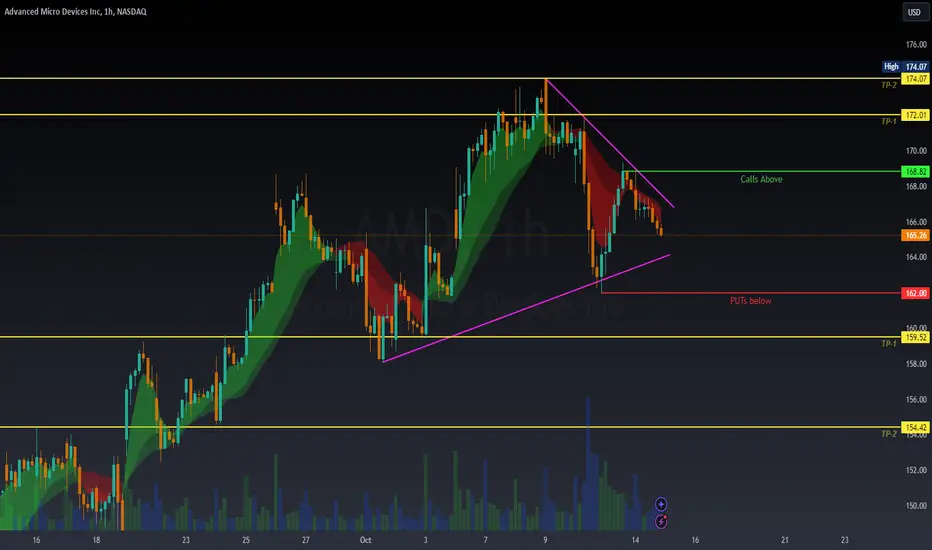
**4H Timeframe Analysis**
I also want to discuss the W-formation, where the price is currently closing a gap. However, we must still account for a potential pullback to the underlying mini-gap. If the $162 level holds, this formation could present a good point for a trend reversal. As mentioned earlier, the $187 level must be broken to confirm the upward structure.
**Conclusion:**
The price shows signs of a potential upward movement on both the monthly and weekly timeframes, with a few critical resistance and support levels to watch. The upcoming event on October 10 could act as a catalyst for further upward movement, but there isn't enough volume to confirm this yet. Be mindful of pullbacks and the trend.
On the Weekly timeframe 5 months ago*, since April, we’ve seen a choch forming with lower highs and lows, signaling a downtrend below the EMA 50. A bullish reversal in January 2023 led to an uptrend, reaching an ATH on March 4, 2024. The current pullback to the 0.5 Fibonacci level, supported by the EMA 50, aligns with an inverted ascending scallop, indicating a potential turning point as the stoch hits the floor.
**Resistance Levels:**
- $313 (Scallop target)
- $227 (#ath)
- $187.28
**Support Levels:**
- $162 (W-formation)
- $140
- Psychological level of $100
*Disclaimer: This is not financial advice. Always do your own research and assess your risks carefully.*

$AMD thank you so much for the LikesNASDAQ:AMD thank you so much for the support!
I successfully tripled a small account on this trade and
I'm still holding my target remains at 230🎯
I'm gonna give you guys a new plan for another multi bagger
❤️ if ur down
