Amd - This is just the beginning!Amd - NASDAQ:AMD - perfectly plays out:
(click chart above to see the in depth analysis👆🏻)
Despite the harsh drop of about -65% which we have been witnessing starting back in 2024, Amd remains bullish. Just three months ago, Amd retested a textbook confluence of support. We saw bullish confirmation, the bottom is in and Amd will rally significantly from here.
Levels to watch: $200, $300
Keep your long term vision!
Philip (BasicTrading)
AMDCL trade ideas

Inverted H&S on AMD BULLISH FOR MONDAY !!!! 150$USD JUNE END!!!Analysis of the Inverted Head and Shoulders
- Left Shoulder: The price first dipped, formed a trough, and then rebounded.
- Head: The stock dropped further, creating a lower trough than the left shoulder, followed by a recovery.
- Right Shoulder: A higher low formed, aligning with the left shoulder before the price moved upward.
- Neckline Breakout: The confirmation of this pattern comes when the price decisively breaks above the neckline (resistance level), suggesting a continued uptrend.
Potential Outcomes
- Bullish Breakout: Once the neckline is breached, a surge in buying pressure could push prices higher.
- Volume Confirmation: Increased trading volume at the breakout strengthens the validity of the pattern.
- Price Target: Traders often project the price increase by measuring the distance between the head and the neckline, then adding this to the breakout point.
Given the current price action, this setup could indicate a strong bullish continuation. However, market conditions and external factors should always be considered before making trading decisions.
If you want to refine this analysis or explore other scenarios, I'm here to dive deeper into key points! 🚀 Subscribe! TSXGanG
I hold a CCVM and MNC (Certificate of Competence to become a securities broker anywhere in Canada) and have been working as a trader for five years.
It’s a pleasure for me to help people optimize their trading strategies and make informed financial market decisions.

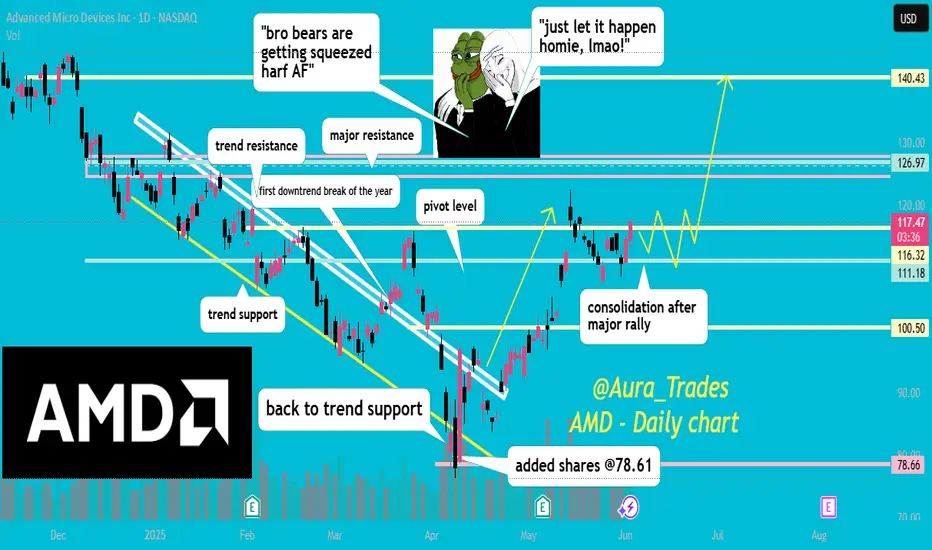
guess whos back? ;) boost and follow for more! 💖 congrats to anyone else who got AMD around 80, massive short trap below trend support and we finally got a break of trend resistance that has held!
I expect a bit of consolidation or maybe even a bit of profit taking, but after thats done a push higher to 126-140 will follow in my opinion.
side note: sorry for being so inactive this year, I've been going through a lot.. but I will try to post more often :)
Amd - This starts the next +200% rally!Amd - NASDAQ:AMD - is preparing a major rally:
(click chart above to see the in depth analysis👆🏻)
It has - once again - not been unexpected at all that we now see a major reversal rally on Amd. After the harsh drop of about -65%, Amd retested a significant confluence of support and already created bullish confirmation. It is quite likely that this now starts the next bullrun.
Levels to watch: $100, $300
Keep your long term vision!
Philip (BasicTrading)

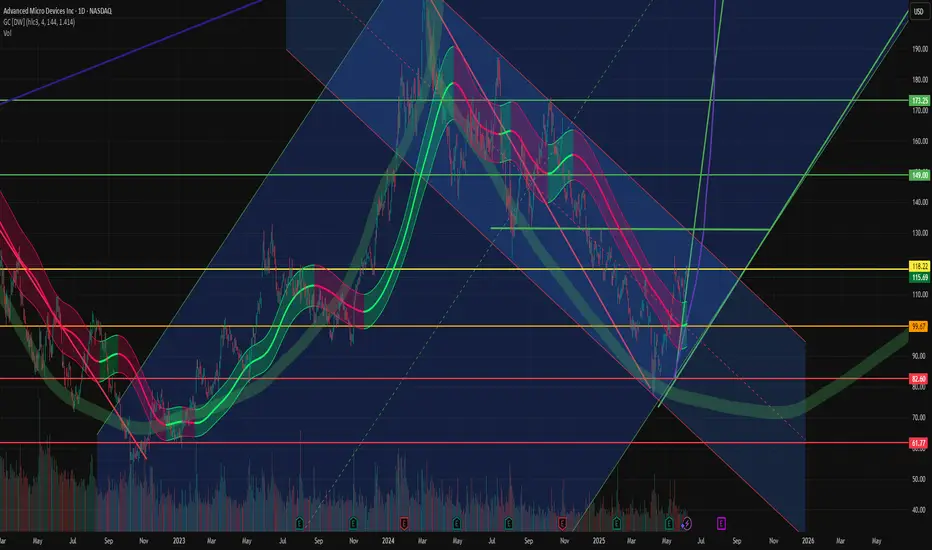
AMD: Simple chart with potential futureAMD: Simple chart with potential future
The market is actually simple, not as complicated as you think — as simple as this naked chart. Most people refuse to learn these simple things, or deliberately complicate matters just to appear like a pro trader.
.
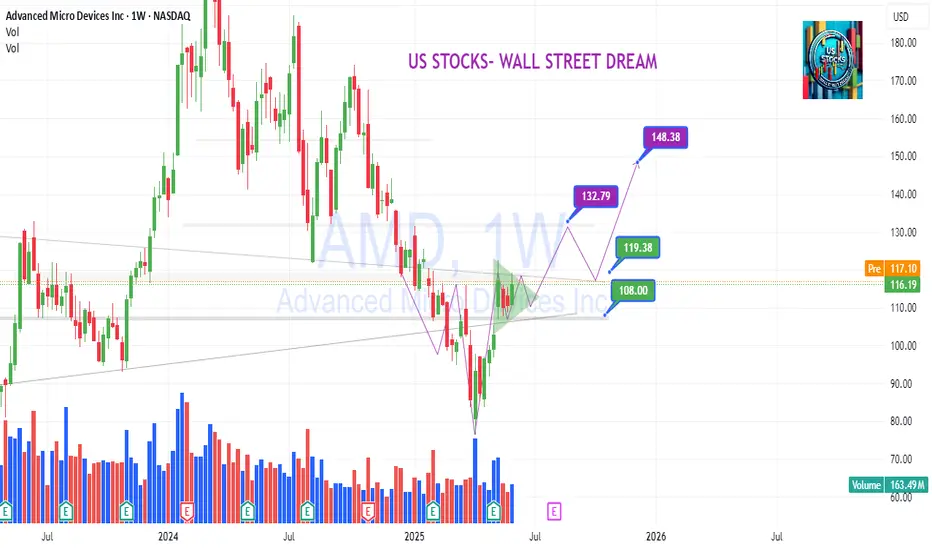
US STOCKS- WALL STREET DREAM- LET'S THE MARKET SPEAK!
AMD will be bullish if we go higher than 128$ USD (CCVM)AMD (Advanced Micro Devices)
Stock appears to show signs of an imminent bullish recovery, according to several technical and fundamental indicators.
Technical Analysis TSX:AMD
- Current Price: $118.87, up 1.33%.
- Bollinger Bands: Indicate moderate volatility, with a trend toward the upper band.
- Trend Lines: A rising purple curve suggests a possible bullish recovery.
- Buy and Sell Zones: Annotations indicate strategic entry and exit points in the market.
Fundamental Analysis
According to the latest market analyses:
- Revenue Growth: AMD recorded a 36% increase in revenue in Q1 2025.
- Strategic Acquisition: The purchase of ZT Systems strengthens its position in data centers and artificial intelligence.
- Stock Buyback Program: AMD announced a $6 billion buyback, boosting investor confidence.
- Analyst Consensus: The average target price is set at $154.45, indicating significant upside potential.
Conclusion
Technical and fundamental indicators suggest that AMD may soon enter a bullish phase.
If you want to refine this analysis or explore other scenarios, I'm here to dive deeper into key points! 🚀 Subscribe! TSXGanG
I hold a CCVM and MNC (Certificate of Competence to become a securities broker anywhere in Canada) and have been working as a trader for five years.
It’s a pleasure for me to help people optimize their trading strategies and make informed financial market decisions.
AMD's Long Awaited Reversal Advanced Micro Devices (AMD) has maintained a well-defined long-term ascending channel since 2019, marked by cyclical touches at both the upper and lower bounds. The current setup signals a bullish reversal following a successful retest of the channel’s lower boundary
AMD now shows a strong bullish reversal:
✅ Broke above a multi-year downtrend line with volume support
📈 Currently retesting resistance $128, a breakout zone historically met with selling
🎯 Channel target projection: $300, offering 140% upside from current price
🔄 Price action consistently respects this trend structure with rhythmically timed expansions every 18–24 months
🧾 Fundamental Tailwinds (2024–2025 Context)
🔥 1. AI Infrastructure & Data Center Dominance
AMD’s MI300X AI GPU series has gained significant traction against Nvidia, with major cloud customers like Microsoft Azure and Meta adopting it for inference workloads.
Revenue from AMD’s Data Center segment surged >80% YoY in Q1 2025, driven by hyperscaler demand and Genoa EPYC chips.
Guidance for 2025–2026 includes double-digit YoY growth across AI and cloud sectors.
🧠 2. Product Roadmap Strength
AMD maintains competitive momentum with Zen 5 CPU launches and RDNA 4 GPU architecture set to arrive late 2025.
Management reaffirmed commitment to high-margin enterprise products and scalable AI inference.
📉 3. Valuation Reset + Earnings Reacceleration
After correcting from $164 to under $100, AMD entered a consolidation phase, allowing for multiple compression reset.
Now trading at ~35x forward P/E (down from 60x peak), with EPS expected to grow >25% YoY into FY2026.
💵 4. Balance Sheet & Buyback Support
Over $5.7B in cash, near-zero debt, and an active $8B share buyback program reinforce shareholder value.
Gross margin in Q1 2025 stood at ~51%, with continued improvements expected from data center mix shift.

Inverse Head and Shoulder on AMD 51%You can easily see this pattern just formed and perhaps playing out. This is huge and will not be too risky if stop loss is under the last shoulder but higher than the most obvious red candle .
Williams Alligator is supporting so better do it now

AMD - Inverted Head & Shoulders (Bullish Reversal)Let´s see if we can break the neckline (White trendline) and stay above with a close and possibly a retest on the neckline to confirm this pattern. If so, Im looking for the previous top on daily which is the all time high (So far).
This is not a financial advise. Always do your own research and decision before investing.

AMD - bulls have the ball nowhi traders,
Let's have a look at AMD stock on the 1D time frame.
AMD is very undervalued now.
It's also very oversold.
The stock market has been dumping hard but it may be a time to see a relief rally.
It's very likely that the bullish divergence and an oversold RSI on 1D time frame may lead to the bounce within the next few days / weeks.
I can't see it going much lower without giving us a solid bounce here.
2 targets are shown on the chart.

$AMD LongBands are super tight on $AMD. It's leading the market today up 4.29% while spy is barely breakeven .09%. Possible news meeting with China today
WH Sr. Adviser Hassett: I am absolutely expecting progress from US-China talks.
Progress from trade talks:
x.com

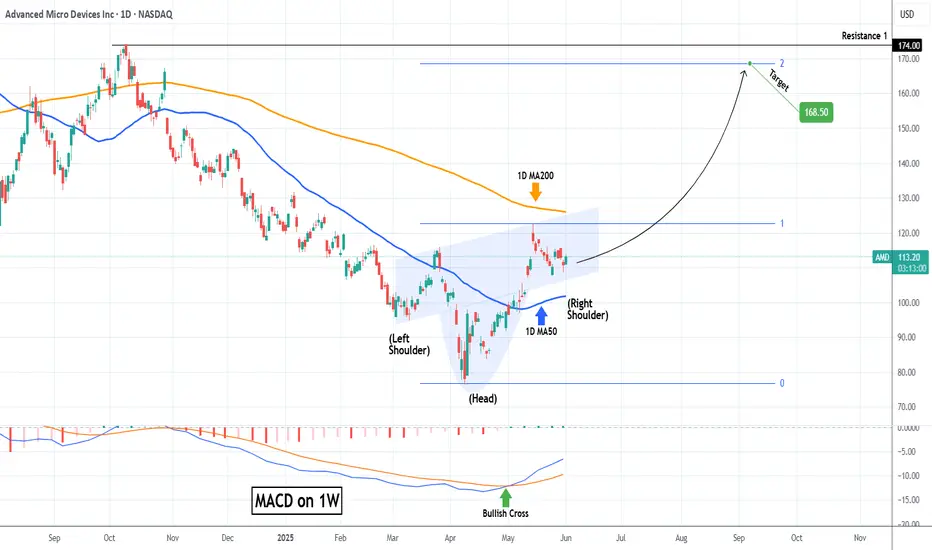
AMD Inverse Head and Shoulders waiting for massive break-out.Advanced Micro Devices (AMD) has entered a wide consolidation range within the 1D MA50 (blue trend-line) and 1D MA200 (orange trend-line) following the May 14 High. From a wider scale, this is technically seen as the Right Shoulder of an Inverse Head and Shoulders (IH&S) pattern.
This is generally a bullish reversal pattern and it is no coincidence that the Head was formed exactly on the market bottom (April 08). With the first long-term buy signal already given by the 1W MACD Bullish Cross, as long as the 1D MA50 holds, a break above the 1D MA200 would confirm the next rally phase.
Technically when the Right Shoulder break-outs take place, they target the pattern's 2.0 Fibonacci extension. That's now exactly at $168.50 and this is our medium-term Target.
-------------------------------------------------------------------------------
** Please LIKE 👍, FOLLOW ✅, SHARE 🙌 and COMMENT ✍ if you enjoy this idea! Also share your ideas and charts in the comments section below! This is best way to keep it relevant, support us, keep the content here free and allow the idea to reach as many people as possible. **
-------------------------------------------------------------------------------
💸💸💸💸💸💸
👇 👇 👇 👇 👇 👇
AMD: Short-term Upward PotentialAMD has continued to face downward pressure, preventing further progress in green wave . While this wave still has room to rise, its top should form below resistance at $141.16. Once wave completes, wave should follow—finishing the larger green impulse to the downside and completing the corrective structure of blue wave (II). This move is expected to conclude in our blue Long Target Zone between $62.82 and $35.19. That said, we continue to monitor a 30% alternative scenario: it suggests that wave alt.(II) has already bottomed at $76.12. In that case, AMD wouldn’t visit the blue zone but instead break out directly above the resistances at $141.16 and $174.98—marking the beginning of wave alt.(III).
📈 Over 190 precise analyses, clear entry points, and defined Target Zones - that's what we do.

AMD - Decision time on the downtrendAnother longer term spec I like. I am a little over weight and slightly down,
Watching for this long term downtrend to break to the upside or reject on the trend line as it has been doing.
probable rejection or a break and retest, we are at the decision point.
Do we reject and head down to retest the recent lows???

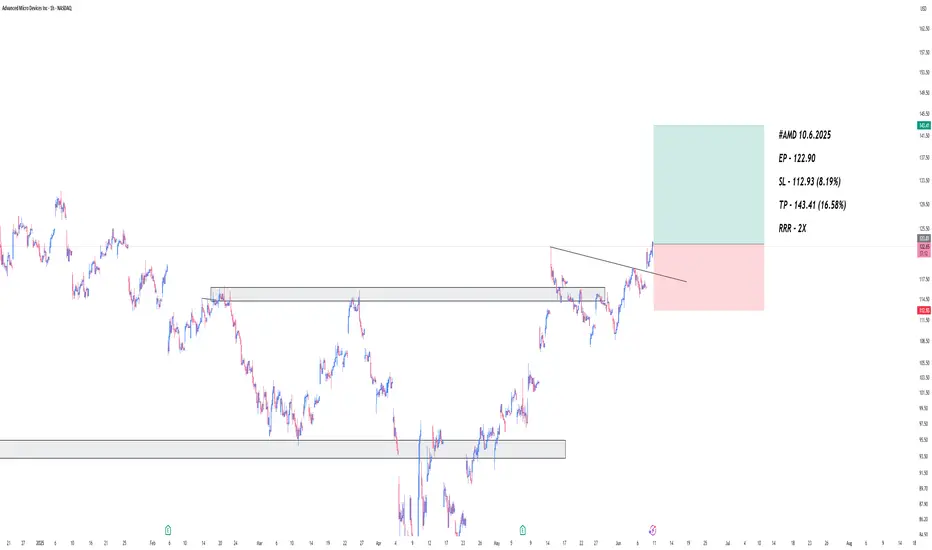
$AMD $120 retest then $130 push through. R/R looks incredible..Hello, NASDAQ:AMD Advanced Micro Devices, INC looks TASTY. I'm almost salivating. NASDAQ:NVDA may take a backseat and NASDAQ:AMD could start seeing monster upside. Something in my gut is telling me this name wants to GO. I'm looking at $120c for 6/20 and $130c for 6/20. This thing can launch.. it's hanging on an upside trendline, it may break but this $110 area may represent local support. Earnings report were good and after an abysmal 2024 after having highs and totally wiping them out hitting lows of $80, I think this could be the time for NASDAQ:AMD longs. It has taken the 20 day EMA/SMA over and now could curl to the 200 day EMA/SMA. 200 SMA is $126. This seems like a really good setup especially R/R here. Very cheap calls for a name that can see a 10-15% week.
WSL.

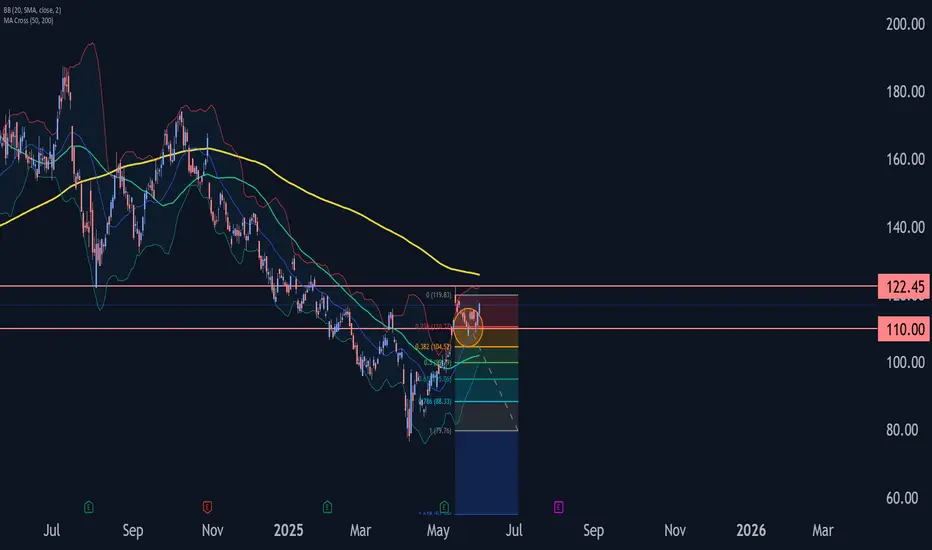
AMD Wave Analysis – 3 June 2025
- AMD reversed from the support zone
- Likely to rise to the resistance level 122.45
AMD recently reversed up from the support zone between the support level 110.00 (low of the previous correction (2)), the 20-day moving average and the 38.2.% Fibonacci correction of the upward impulse from April.
The upward reversal from this support zone started the active intermediate impulse wave (3).
AMD can be expected to rise to the next resistance level 122.45 (which stopped the earlier intermediate impulse wave (1) at the start of May).
AMD breaking outAMD entered the 96 to 115 box like a rocket, and it is now showing a lot of strength after being dormant for a while.
The conditions are now there for a gradual run-up towards the 172 level. If it comes back below the 96 mark, I would argue that the movement has aborted.

AMD is at the daily 200MA resistance The last 4 times AMD have rejected this moving average the result has been downside action

retrace to 105-110 likely after "Advancing AI" event wraps todayAMD has not had a significant retrace since the bottom on 4-21-2025 and is overdue for one.
AMD stock dropped ~4% after the previous "Advancing AI" event on 10-10-2024, and went into correction over a 2 week period following.
Note that AMD stock did not sustain positive momentum today after the Saudi Arabia cloud news, lending more weight to buyer exhaustion in the short term.

AMD Approaching Key Supply Zone – Rejection or Breakout?📌 Thesis:
AMD is approaching a critical 1D supply zone ($122–$130) with bearish RSI divergence, suggesting possible short-term exhaustion.
🔍 Technical Overview:
✅ Structure: Bullish recovery confirmed with Break of Structure (BoS).
📈 Price Action: Higher highs into known supply zone.
📉 RSI: Forming lower highs, showing classic bearish divergence — a common warning signal near key resistance.
🧭 MACD: Still positive, but momentum is slowing.
📊 Volume: Healthy, but not confirming a breakout (yet).
📌 Base Case (Bias):
Rejection from supply zone is likely, given weakening momentum. Watch for bearish reversal candles around $122–$130.
If rejection confirms:
🎯 First target: EMA cluster ($116).
🛑 Invalidation: Clean breakout above $130 with volume.
🔁 Alternate Scenario:
If AMD breaks and holds above $130, divergence is invalidated.
Next upside target: $140–$150 (previous resistance zone).
✅ Trade Plan:
🔹 Short setup: Bearish rejection + divergence confirmation at supply zone.
🔹 Long setup: Breakout + retest of supply zone turned support.
Conclusion:
This is a technical inflection point for AMD. Price action in the coming sessions will likely define the short-term direction. Trade the setup, not the prediction.

$AMD When, not IF! 105% UPSIDENASDAQ:AMD - It's not a matter of if, but when...🚀
Once this downtrend on the weekly is broken out of with a big fat engulfing candle we will launch off this volume shelf like a SpaceX rocket to mars!
All indictors are curling up and I think the time is coming for AMD to make their ascent higher and back to ATHs!

AMD LONG IDEA: AMD IS READY FOR A GOOD BULLISH RUNAMD is bouncing off the monthly time frame key level that is acting as support for price.
On weekly time frame and daily we had a shift in market structure from bearish trend to bullish.
I will be buying AMD on this retracement to the recent weekly gap created by price.
Once I see a good bullish price confirming that the retracement is over, i will enter for a buy trade.
My overall target is the 187 price level.
