Amazon: Riding the E-Commerce and Cloud WaveAmazon is currently showing promising signs as it forms the right side of its base, presenting an excellent setup for long-term investors. With strong revenue streams from e-commerce and Amazon Web Services (AWS), the company remains a dominant force in multiple sectors. This diverse business model positions Amazon for sustained growth, even amid market fluctuations.
Technical Overview:
Recent price action shows Amazon bouncing off a strong support level around $182.38 , with its 21-day EMA acting as a key indicator of momentum. As it approaches the $200 mark, investors should keep a close eye on these critical levels.
Profit Target: Initial target at $201.20 , with further potential upside to $210 if momentum continues.
Stop Loss: Set just below the $182.38 support level to manage risk.
Indicator Insights:
Using tools like the MTF Squeeze Analyzer - and MTF SqzMom , we notice a squeeze firing on multiple lower timeframes, signaling that volatility is likely to increase. The 4Hour and Weekly timeframe shows a build-up in momentum, suggesting that this could propel Amazon toward the $200+ range. Monitoring these momentum shifts provides an edge in timing entry and exit points for the trade.
Momentum and Market Overview:
With the Larry Williams Valuation Index Indicator, we observe steady momentum on both the daily and weekly charts, supporting a positive outlook. The readings show consistent strength in Amazon’s price action. Notably, the stock has not yet reached its overvalued level , signaling a fair entry point for buyers. This provides confidence that Amazon is trading within a favorable range, with the market continuing to support buying interest.
Additionally, the general market is in an uptrend, as confirmed by the IBD Market School , with 100% exposure currently active and the Power Trend ON . This signals a favorable environment for growth stocks like Amazon.
Final Thoughts:
This trade idea leverages both fundamental strength and technical precision, supported by our indicators available in the TradeVizion toolset. By combining a clear understanding of Amazon’s market dominance with insights from these smart tools, this setup offers a well-rounded opportunity for both short-term gains and long-term growth.
Feel free to explore our scripts, designed to enhance your market understanding without overwhelming you with unnecessary complexity. Whether you’re trading breakouts or managing risk, having the right tools in your corner can make all the difference.
AMZNCL trade ideas

AMZN Reversal Setup: Trading Plans for Upcoming Momentum Nov 20AMZN is showing signs of recovery after a sharp sell-off, reclaiming key levels with momentum building on the hourly timeframe. With potential for both scalping and swing trades, this setup focuses on exploiting AMZN’s trend reversal opportunities. Here’s a detailed trading plan based on price action, liquidity zones, and technical insights.
Market Structure Overview
* Descending Trendline Breakout: AMZN has successfully broken out of a steep descending trendline, indicating a reversal attempt.
* Consolidation Phase: The stock is consolidating between $200.00 and $205.00, gearing up for a directional move.
* Volume Insights: Rising volume near support levels suggests accumulation and potential upside momentum.
Liquidity Zones
* Demand Zone (Support): $198.50 - $200.00. Strong buying activity has been observed here, making it a crucial level for bulls to defend.
* Supply Zone (Resistance): $205.00 - $208.00. Sellers may emerge in this range, as it aligns with previous rejection zones.
Order Blocks
* Bullish Order Block: $198.50 - $200.00. This zone could serve as a launching pad for further upside moves.
* Bearish Order Block: $205.50 - $207.00. Watch for potential rejections or profit-taking here.
Key Levels
* Support Levels: $198.50, $200.00.
* Resistance Levels: $205.00, $208.00, $215.99.
Technical Indicators
* 9 EMA & 21 EMA (Hourly): AMZN has crossed above these levels, signaling short-term bullish momentum.
* MACD (Hourly): Bullish crossover with increasing histogram bars, confirming upward momentum.
* RSI (Hourly): Neutral at mid-50s, offering room for further upside before overbought conditions.
Scalping Plan
* Entry: Enter long on pullbacks to $203.50 - $204.00 with confirmation from bullish candles.
* Exit: Target $205.50 for partial profits, extending to $207.00 if momentum sustains.
* Stop-Loss: Place a tight stop at $202.50 to manage risk.
* Game Plan: Use quick momentum-based entries during volume spikes, particularly near breakout levels.
Swing Trading Plan
* Entry: Accumulate positions near $200.00 - $201.00 for a potential upside move.
* Exit: First target at $208.00, with extended targets at $215.99 for a larger move.
* Stop-Loss: Place a stop-loss below $198.50 to protect against further downside.
* Game Plan: Wait for confirmation of a higher low on the hourly timeframe to add confidence to the swing setup.
Projection
AMZN’s breakout and consolidation above $200.00 indicate potential for a move toward $208.00 and $215.99 in the coming sessions. However, failure to hold $200.00 could see a retest of $198.50, offering another entry point for longs.
My Thoughts
AMZN is well-positioned for a continuation of its recovery trend. Scalpers can focus on quick trades between $203.50 and $205.50, while swing traders may find attractive opportunities near $200.00 with targets at $208.00 and beyond. Maintain discipline with stops and let the chart guide your trades.
Disclaimer
This analysis is for educational purposes only and does not constitute financial advice. Always perform your own research and consult a financial professional before making trading decisions.

$AMZN: Market OutlookNASDAQ:AMZN : Market Outlook
NASDAQ:AMZN is in my GOLDEN ZONE, primed for a potential LONG setup. I’m watching for an UPTREND and RETEST (green arrow) to make my move. Targeting the DAILY GAP.
Like and follow and I will keep you updated!

AMZN TO TEST $195 and then LONG and make new highswww.tradingview.com
VOLUME dips when price increase from $200 level and increase when price dips meaning $200 level buyers and exhausting.
High selling pressure from ATH and today morning near $204.50 make sense that bears getting stronger for near term.
On 4H chart, VOLUME divergence on two highs, when price and volume increased on first high and volume dips on 2nd high (ATH) or even on breakout from first high level. Thus showing low interest in buying at high levels for at least short term.
$195 level getting support from 200 day MA

Can Two Paths of Wealth Lead to the Same Mountain of Impact?In an era where wealth accumulation often dominates financial headlines, Amazon's founding family presents a fascinating dichotomy that challenges our traditional understanding of success and impact. Jeff Bezos and MacKenzie Scott, once united in building one of the world's most valuable companies, now demonstrate how divergent approaches to wealth management can equally shape our future, albeit through distinctly different lenses.
The stark contrast becomes apparent in their recent financial movements: Bezos's methodical $5.1 billion stock sale through a carefully orchestrated 10b5-1 trading plan showcases traditional wealth management at its finest, maintaining significant control while diversifying assets. Meanwhile, Scott's bold $8 billion divestment for charitable causes, part of her larger $37 billion philanthropic initiative, revolutionizes the concept of billionaire responsibility. This juxtaposition raises intriguing questions about the multiple paths to creating lasting societal impact.
What emerges is a compelling narrative about the evolution of wealth stewardship in the 21st century. While Bezos continues to influence global markets and pioneer space exploration with his retained $213 billion in Amazon shares, Scott's approach of direct, unrestricted funding to over 2,300 nonprofit organizations challenges traditional philanthropic models. Their contrasting strategies suggest that perhaps the true measure of wealth lies not in its accumulation, but in its potential to effect change – whether through market innovation or direct societal intervention. This modern tale of two wealth philosophies invites us to reconsider our own definitions of success and impact in an age of unprecedented financial capability.

Aiming for Resilience: Trading Strategies for Amazon Next WeekRecent Performance: Amazon has faced significant market fluctuations recently,
experiencing a loss of over 4%. The stock reached a temporary high before
encountering resistance, resulting in sideways trading patterns. Market
pressure has intensified following competitive tensions with other
companies, particularly Hims and Hers, which contributed to Amazon's
decline. The overall sentiment surrounding Amazon is notably negative,
impacting investor confidence.
- Key Insights: Investors should carefully evaluate potential entry points for
trading Amazon. The recent resistance levels indicate a possible
continuation of bearish momentum, warranting caution in long positions. With
Amazon's advertising strategy anticipated to improve revenue, understanding
when to enter or exit trades could be crucial as the stock approaches key
price levels.
- Expert Analysis: Market experts express concerns regarding Amazon's
positioning, particularly with the integration of its advertising strategy
and increasing competition in sectors such as telehealth. While the long-
term outlook remains bullish, a current bearish sentiment requires strategic
adjustments by investors. The anticipated holiday season could serve as a
catalyst for a potential turnaround.
- Price Targets: Based on the wisdom of all professional traders, the following
price targets and stop levels are recommended for Amazon:
Next week targets: Target 1: 208.79, Target 2: 216
Stop levels: Stop 1: 200, Stop 2: 198
Longer-term targets include a potential move to the resistance at 230 within the
next two months, contingent on market conditions.
- News Impact: Significant news impacting Amazon includes its entry into the
telehealth market, inducing a sharp decline in Hims and Hers shares.
Additionally, Amazon's plan to enhance advertising on its platforms could
provide substantial revenue boosts, positioning it favorably for long-term
growth despite recent trading pressures. The robotaxi market also presents
new strategic avenues for Amazon's growth, garnering interest from
investors.
AMZN: Strong Rebound or Further Downside? Nov. 18, 2024Amazon (AMZN) has experienced a significant pullback, but signs of a potential bounce are emerging. With strong volume near critical levels, it offers opportunities for both scalping and swing trades. Let’s break down the key zones and actionable setups.
Technical Overview:
Market Structure:
Trend: Downtrend from recent highs, with buyers attempting to establish a base near $202.50.
EMA Levels: Price is below the 9 EMA (purple) and 21 EMA (blue), suggesting bearish pressure but with potential for a recovery.
Key Levels:
Resistance Zones:
$205.50 – Key resistance aligned with previous support-turned-resistance.
$209.90 – Psychological resistance and prior high.
$216.00 – Major supply zone from the recent highs.
Support Zones:
$202.00 – Current support level holding strong.
$200.00 – Psychological support.
$198.00 – Critical demand zone.
Supply and Demand Zones:
Demand Zone: $200.00–$202.00 (buyers stepping in with high volume).
Supply Zone: $205.50–$209.90 (sellers dominating at these levels).
Indicators:
MACD: Histogram shows bearish momentum slowing, with a potential bullish crossover developing.
Volume: Increasing green volume bars indicate growing buyer interest near $202.00.
Pattern:
Descending channel with potential for a breakout above $205.50.
Game Plan:
Scalping Plan (1-Min and 5-Min Timeframe):
Entry for Long:
Buy if price breaks above $205.50 with strong volume.
Target 1: $207.50 (mid-supply zone).
Target 2: $209.90 (upper resistance zone).
Entry for Short:
Sell if price rejects $205.50 or breaks below $202.00.
Target 1: $200.50 (psychological level).
Target 2: $198.00 (demand zone test).
Stop Loss:
Long: Below $204.50.
Short: Above $206.00.
Swing Trade Plan:
Bullish Scenario:
Buy if price holds above $202.00 and breaks above $209.90.
Target 1: $216.00 (major supply zone).
Extended Target: $220.00 (channel breakout target).
Stop Loss: Below $200.00.
Bearish Scenario:
Sell if price fails to hold $202.00 and breaks below $200.00.
Target 1: $198.00 (demand zone).
Extended Target: $195.00 (lower channel boundary).
Stop Loss: Above $203.50.
My Thoughts:
For Scalping: Focus on breakouts or rejections at $205.50 for quick trades. Keep an eye on volume to confirm direction.
For Swing Trades: Price action around $202.00 is critical. Holding this level sets up a bullish move, while failure could lead to further downside.
Directional Bias:
Short-term: Neutral-to-bullish if $202.00 holds as support.
Mid-term: Slightly bearish unless price reclaims $205.50 convincingly.
Actionable Suggestions:
Monitor $202.00 for signs of a potential bounce.
Watch for breakout or rejection at $205.50 to plan scalping trades.
Avoid trading within the $202.00–$205.50 range to reduce noise.
Disclaimer:
This analysis is for educational purposes only and not financial advice. Always use proper risk management when trading.

AMAZON WILL GROW|LONG|
✅AMAZON is approaching a demand level of 200$
So according to our strategy
We will be looking for the signs of the reversal in the trend
To jump onto the bullish bandwagon just on time to get the best
Risk reward ratio for us
LONG🚀
✅Like and subscribe to never miss a new idea!✅

AMZN AB=CB Amazon (AMZN) AB=CD Pattern Analysis
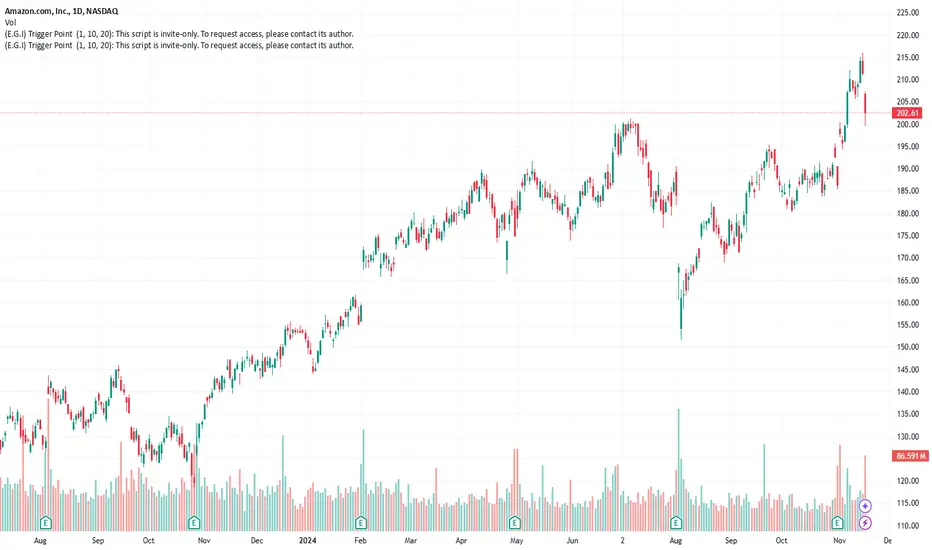
Current Price: $202.61 (-4.19%)
The 10D chart of AMZN highlights a potential AB=CD harmonic pattern forming, which could signal an important price move in the near future. Here’s the breakdown of the structure:
1. Leg AB:
• The initial bullish move (leg AB) set the stage for the current uptrend, with price moving sharply from the lows to a key resistance zone around $215.90.
2. Leg BC:
• A healthy pullback followed, creating leg BC. This retracement found support near critical moving averages, suggesting strength in the trend.
3. Leg CD (Projection):
• Based on the symmetry of the AB=CD harmonic pattern, the projected completion point for the CD leg aligns with the $270.92 resistance level. This confluence strengthens the case for a significant move toward this target.
4. Key Levels to Watch:
• Resistance at $215.90: AMZN needs to break this level decisively to confirm the continuation of leg CD.
• Support at $81.96: A failure to sustain the current uptrend could invalidate the pattern and lead to a retest of this major support level.
5. Bullish Implications:
• If the AB=CD pattern plays out, we could see AMZN rally toward $270.92, offering a strong reward-to-risk opportunity for traders.
6. Risk Management:
• The pattern is invalidated if AMZN breaks below the BC low, signaling a potential shift in market sentiment.
Takeaway: The AB=CD pattern on AMZN’s chart provides a clear roadmap for both bulls and bears. A confirmed breakout above $215.90 opens the door for a rally toward $270.92, but traders should remain cautious of invalidation signals.
What’s your perspective on this potential harmonic move? Are you preparing for the breakout?

AMAZON Local Long! Buy!
Hello,Traders!
AMAZON is about to retest
A horizontal support level
Around 200$ and after the
Retest we will be expecting
A local bullish rebound
Buy!
Like, comment and subscribe to help us grow!
Check out other forecasts below too!


AMAZON: Small pullback expected. Buy the dip.Amazon is trading inside a Channel Up on the 4H timeframe, supported by both the 4H MA50 and the 4H MA200 and almost overbought on its 1D technical outlook (RSI = 68.804, MACD = 6.500, ADX = 38.620). The 4H RSI is printing a sideways pattern which was a sell signal when the previous bullish waves peaked. The first pulled back to the 0.382 Fib, the second to the 0.5 Fib. Consequently we expect a quick pullback here but technically the dip should be bought on the 0.382 Fib. Our target after that will be near the top of the Channel (TP = 230.00).
See how our prior idea has worked out:
## If you like our free content follow our profile to get more daily ideas. ##
## Comments and likes are greatly appreciated. ##

AMZN Approaching Key Resistance: Potential Breakout. Nov. 14, 24Amazon (AMZN) has been climbing steadily and is now testing a significant resistance level. Let’s dive into the supply and demand zones, price action, MACD, volume, and EMA indicators to spot actionable levels for scalping and swing trades.
Market Structure Overview:
AMZN is in an uptrend, approaching a strong resistance level around $215. The recent bullish momentum suggests a potential breakout, but with resistance nearby, a pullback could also occur. AMZN’s positioning near its highs makes this a critical area to watch.
Key Zones:
Demand Zone (Support): $210.74 - $212.00
This area has consistently attracted buyers, providing immediate support. If AMZN retraces to this level and shows signs of holding, it could be a great entry point for a long position.
Supply Zone (Resistance): $214.30 - $215.09
This range represents resistance, where previous attempts to break higher have faced selling pressure. A breakout above $215 with volume would signal bullish continuation, while rejection at this level could result in a pullback.
Order Block Insight:
An order block is visible around $212-$213, where institutional interest seems active. Reactions at this level could guide short-term trades, especially for scalpers watching for breakouts or bounces.
Support & Resistance with Entry, Exit, and Stop Suggestions:
Immediate Support: $212
Long Entry: Around $212 if there’s a bounce, targeting exits at $214 and $215.
Stop-Loss: Below $210 to manage risk if AMZN breaks lower.
Immediate Resistance: $215
Short Entry: Near $215 if resistance holds, with targets at $213 and $212.
Stop-Loss: Above $216 to limit potential losses if a breakout occurs.
Swing Trade Setup:
Swing Long: Above $215.09, targeting $218 and $220 if momentum sustains.
Stop-Loss: Below $214 to control risk if the breakout fails.
Swing Short: Below $210, aiming for $205 as the next support level.
Stop-Loss: Above $212 to manage risk if AMZN reverses.
Price Action Insights:
AMZN’s recent move toward $215 reflects strong buying interest, but the price action shows a slight hesitation near this level. A confirmed breakout above this range could signal a bullish continuation, while a rejection could see the stock retrace to the $212 support zone.
MACD and Volume Analysis:
MACD: The MACD shows a bullish crossover with a positive histogram, indicating upward momentum. This aligns with the potential for a breakout if AMZN clears $215 with strong volume.
Volume: Volume has increased during the recent uptrend, supporting the price action. Higher-than-average volume near $215 would add confidence to a breakout scenario. Low volume, however, may result in a lack of follow-through, increasing the chance of a pullback.
9 EMA & 21 EMA Analysis:
9 EMA: AMZN is trading above the 9 EMA, indicating short-term bullish momentum. If the price stays above this level, it suggests continued strength, making it a good signal for scalpers.
21 EMA: The 21 EMA is below the 9 EMA, confirming the uptrend and providing additional support. As long as AMZN remains above both EMAs, bullish momentum should persist.
Scalping & Swing Outlook:
Scalping: Look for quick long entries around $212 for bounces toward $214 or $215. For short scalps, $215 provides a resistance zone to play with a pullback toward $213. Tight stops are recommended given the current volatility.
Swing: A breakout above $215 with volume would favor swing longs, aiming for higher price targets. On the other hand, a break below $210 would open the door for short opportunities targeting $205.
Directional Thoughts & Suggestions:
AMZN’s current setup suggests a slight bullish bias if it can break through $215. My suggestion is to watch for a potential breakout above $215.09, targeting $218 if momentum holds. However, if AMZN fails to break this level and volume dries up, a short-term pullback toward $212 or $210 becomes more likely.
Conclusion:
AMZN is at a critical resistance level, with setups for both bullish and bearish moves. Scalpers and swing traders should monitor the price action and volume closely around $215. Keeping tight stops and observing reactions at these levels will be crucial to managing risk effectively.
Disclaimer: This analysis is for educational purposes only and not financial advice. Please conduct your own research and consult with a financial advisor. Trading involves risks, and past performance does not guarantee future results.

AMAZON Minor pull-back and then off to $240.Amazon Inc. (AMZN) has been following our bullish signal within the Channel Up we indicated on August 23 (see chart below) very accurately and is halfway through to our $240.00 long-term Target:
This is also confirmed on the lower time-frames, namely the 1D on this chart, where the stock can be seen trading within a Channel Up and having started its most recent rebound on the 1D MA50 (blue trend-line).
The first Bullish Leg of the Channel Up, pulled-back to the 1D MA50 (and Fib 1.0) after approaching the 1.382 Fibonacci extension level and then rebounded aggressively to hit (and even break) the 2.0 Fibonacci extension. Even the 1D CCI sequences between the two fractals are quite similar.
As a result, we don't dismiss the possibility of a 1D MA50 pull-back but that will be another buy opportunity on Amazon's way to $240.00.
-------------------------------------------------------------------------------
** Please LIKE 👍, FOLLOW ✅, SHARE 🙌 and COMMENT ✍ if you enjoy this idea! Also share your ideas and charts in the comments section below! This is best way to keep it relevant, support us, keep the content here free and allow the idea to reach as many people as possible. **
-------------------------------------------------------------------------------
💸💸💸💸💸💸
👇 👇 👇 👇 👇 👇

AMZN: Rising Wedge Formation with Key Support and Resistance📌 Overview
Amazon Inc. (AMZN) appears to be forming a rising wedge pattern on the 1-hour chart, typically signaling potential bearish reversal if support levels do not hold. Current price action is testing significant resistance levels, and the 9 EMA and 21 EMA are in play to provide momentum signals. Let’s analyze the key levels, indicators, and potential trade setups.
📊 Current Trend on the 1-Hour Chart
The 1-hour chart shows a series of higher lows, with price moving upward in a narrowing range, forming a rising wedge pattern. This setup often indicates a potential bearish reversal, especially if price fails to break above resistance.
Short-term bullish momentum is present, but there are signs of slowing as the price approaches resistance zones.
📉 Key Levels
Resistance Levels:
$212.25: The most recent high and an important resistance level. A breakout above this level, particularly with volume, could suggest bullish continuation despite the rising wedge structure.
$210.68 - $209.00: The ask price at $209.00 and nearby resistance at $210.68 are key zones where price has been struggling. A rejection here could lead to a pullback to lower support levels.
Support Levels:
$205.62: This is a critical support level and the lower boundary of the rising wedge pattern. A breakdown below this level, especially with volume, could trigger a bearish move.
Trendline Support: The upward trendline from the wedge formation is another potential support area. If price respects this line, it could provide short-term bullish support, but a break below would reinforce bearish sentiment.
🔄 Indicators
9 EMA and 21 EMA:
The 9 EMA (faster-moving) and 21 EMA (slower-moving) are converging, suggesting a potential shift in momentum. If the 9 EMA crosses below the 21 EMA, it would add to the bearish case, while a cross above could support a bullish breakout.
MACD:
The MACD shows signs of weakening momentum, with the histogram flattening and a potential bearish crossover forming. This aligns with the possible reversal signal from the rising wedge pattern.
Volume:
Volume has been decreasing as AMZN approaches the resistance zone, a typical signal in wedge formations. A volume spike upon breakout or breakdown will be crucial in confirming the direction of the next move.
🛠 Trade Setup
Bearish Scenario:
If AMZN breaks below $205.62, it could indicate a breakdown from the rising wedge pattern, suggesting potential downside. In this scenario, a target could be around $202, with further downside possible if selling pressure persists.
Bullish Scenario:
A breakout above $212.25 with increased volume would invalidate the wedge’s bearish potential, signaling bullish continuation. In this case, targets would be $215 and higher.
⚠️ Risk Management
Stop-Loss: For a bearish entry, consider a stop-loss above $210.68. For a bullish trade, place a stop-loss below the lower trendline or $205.62 to limit losses if the wedge breakdown occurs.
Position Sizing: Adjust position size according to risk tolerance, as a breakout or breakdown can bring significant volatility.
📚 Key Takeaways
AMZN is in a rising wedge pattern on the 1-hour chart, typically a bearish setup.
Key levels to watch include $212.25 for resistance and $205.62 for support, with the 9 EMA and 21 EMA giving additional trend clues.
Volume and MACD will be essential for confirming any breakout or breakdown.
💬 Conclusion
Amazon Inc. (AMZN) is at a critical juncture with a rising wedge pattern on the 1-hour chart, indicating possible bearish pressure if support fails. Traders should monitor volume and EMA crossovers to confirm the next move, whether it’s a breakout or breakdown.
Disclaimer:
This analysis is for educational purposes only and should not be considered financial advice. Conduct your own research or consult with a financial advisor before making trading decisions.

Amazon Stock (AMZN) Holds Above $200Amazon Stock (AMZN) Holds Above $200
On Thursday, October 31, Amazon released its Q3 earnings report:
→ Earnings per share: actual = $1.43, forecast = $1.14;
→ Gross sales: actual = $158.8 billion, forecast = $157.2 billion.
The report exceeded analyst expectations, with additional optimism driven by Trump’s victory and a Fed rate cut, pushing Amazon’s stock price past the psychological $200 mark and reaching a new high above $210.
Today, Amazon’s stock chart shows the price beginning to round off (indicated by an arrow). Does this signal the end of the bullish trend?
Unlikely, given the strong fundamental support. In technical terms, it may be more accurate to consider the price’s vulnerability to a correction, especially as it sits near the upper boundary of an ascending channel.
Should a correction occur, a retest of the $200 level is possible. Support may come from the median line of the long-term blue channel or the lower boundary of the short-term black channel.
According to TipRanks, which surveyed 45 Wall Street analysts:
→ 44 analysts recommend buying AMZN stock;
→ On average, they forecast a 12-month price target of $238.
This article represents the opinion of the Companies operating under the FXOpen brand only. It is not to be construed as an offer, solicitation, or recommendation with respect to products and services provided by the Companies operating under the FXOpen brand, nor is it to be considered financial advice.

amazonTLDRForming good software development habits can significantly enhance speed and maintain quality. Key practices include making small commits, continuous refactoring, prioritizing working software, creating new modules for disparate functions, and focusing on test-driven development (TDD) to anticipate edge cases. Avoid

AMZN tomorrow@nuxtandvue
Hey there! Welcome to The Looop Tech - Vue.js. I’m your host IGC , your friendly neighborhood Vue.js enthusiast! Join me each week as I chat about the latest Vue.js news, share fun tips, and dive into all things Nuxt.js. It’s just me here, so if you’

Amazon (AMZN) Long Side Analysis: Staying Bullish with CautionHey Again Folks!
Just wanted to share some thoughts on Amazon (AMZN) — I’m still leaning on the 🔵 long side here, but keeping a close eye on a few key levels.
Right now, AMZN is sitting around the $206-210 range, and it’s getting close to that resistance up at $213 🟢. This has been an important level before, so I’m watching to see if we can push through it with some strength 💪.
If we get a strong breakout above $213 🔥, I think the next target to watch is around $236 📈. That area lines up with previous highs and could be the next stop if this momentum keeps up. But if we hit resistance and start pulling back, I’ll be watching the lower boundary of the channel and especially the $190 zone for support 🛠️.

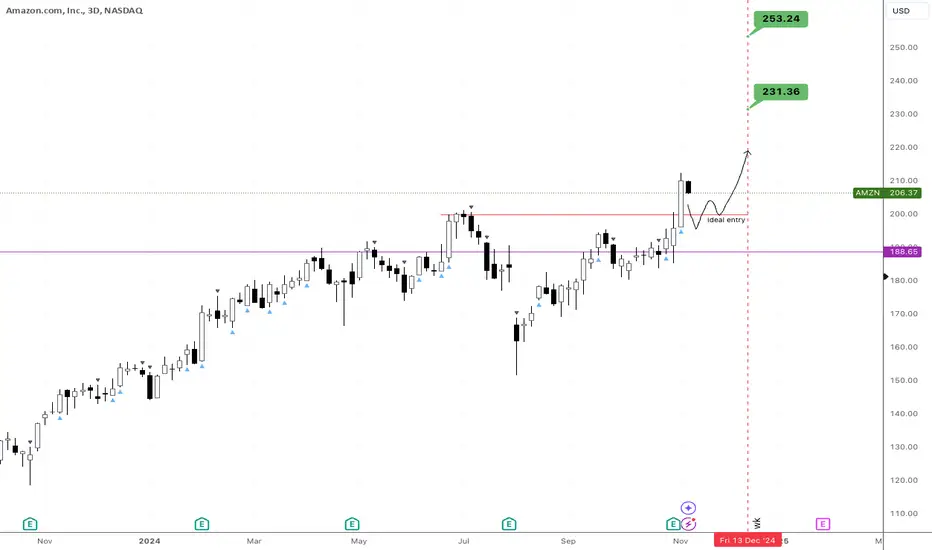
Prime'd for Profits: Amazon at Price DiscoveryNASDAQ:AMZN is currently trading at price discovery. Last weekly candle closed with lots of strength above precious all time high. Any retrace is a chance to jump in and increase our positions.
Bullish time at mode trend has just been confirmed.
- Expiry is set for mid December
- Targets of $231 and $253's at first .
- Entry dca at low $200’s to $180's
Amazon Prepares for Strong Holiday Season GainsAmazon has recently reached new all-time highs, signaling robust
performance fueled by strong consumer demand as we approach the holiday season.
The stock has traded above the critical $200 level, demonstrating strong
momentum that positions it well to capitalize on winter sales activity. However,
valuation concerns linger due to its high-profile status alongside companies
like Apple, which could temper enthusiasm in the broader market context.
- Key Actionable Insights: Investors should monitor Amazon's ability to maintain
its upward trajectory, particularly as it approaches resistance levels around
$230-$250. With the upcoming holiday sales expected to boost revenues, now is a
critical time to evaluate entry points. Set alerts for price movements
surrounding these key levels and consider taking action if favorable trends
continue.
- Sentiment Analysis: The current sentiment for Amazon stands at 45.95,
reflecting a 3.69-point increase from last week's sentiment of 42.26. With total
mentions across sources at 22, this positive shift suggests a growing bullish
perspective among analysts and traders, indicating potential investor confidence
in Amazon's performance.
- Summary of Expert Opinions: Experts remain optimistic about Amazon's outlook,
particularly given the recent partnership with AWS and Anthropics to strengthen
its AI capabilities. Analysts cite the company's strong position for holiday
season sales and a projected price target boost to around $230, signifying that
the stock could continue to thrive even amid broader market volatility.
- Technical Levels: Based on the wisdom of all professional traders, immediate
target levels for Amazon are set at $220 (target 1) and $250 (target 2), with
recommended stops at $205 (stop 1) and $200 (stop 2). Longer-term ambitions
include a target of $250, expected within the next few weeks as the holiday
shopping season ramps up.
- Notable News: Recent headlines highlight Amazon's expected strong performance
during the holiday season, alongside Jeff Bezos's substantial stock sale, which
has raised some eyebrows regarding insider confidence. Additionally, the
integration of advanced AI strategies positions Amazon as a competitive player
in the tech space, further solidifying its market viability going forward.

AMZN Technical Analysis for Nov.11, 20241. Trend and Price Channels
Looking at the 1-hour chart, AMZN is in a strong upward channel. The stock recently tested a high of around $212.25, but has since pulled back slightly. The support line on this upward channel is holding well, keeping the bullish momentum intact. We should watch for a break above $212.25 for continuation, with the next potential target around $215 if the momentum sustains.
2. Moving Averages (EMA)
The short-term EMAs, such as the 9 and 21 EMA, are showing a steady upward slope, reflecting strong bullish sentiment. As long as AMZN remains above these EMAs, the trend should stay positive. For scalpers, buying near the 9 EMA could offer good entry points in an uptrend, but a close below the 21 EMA might suggest caution as it may indicate a pullback.
3. Momentum and Volume
The recent rally was supported by decent volume, but volume has tapered slightly. This reduction could signal a cooling period or consolidation. The MACD and RSI (not shown here) can provide further insights. For a short-term view, if MACD shows bearish divergence or if RSI enters overbought territory, it could mean a pullback is imminent. Swing traders should consider entering after a confirmed breakout above recent highs with strong volume to minimize risk.
4. Key Support and Resistance Levels
Immediate Support: Around $208.20 (current bid level)
Secondary Support: Near $200.34
Resistance to Watch: $212.25 (current high); beyond that, look for $215
Trade Suggestions
Scalping: For scalpers, consider entering long positions on pullbacks to $208 - $209 with a target back toward $212. If price action shows weakness near $212, shorting briefly could be viable, but this is higher risk given the overall uptrend.
Swing Trading: If AMZN breaks above $212.25 with strong volume, consider a swing trade targeting $215 or higher. A break below $200 could signal a deeper pullback or consolidation, so manage risk accordingly.
Disclaimer: This analysis is for educational purposes only and should not be considered financial advice. Always perform your own research or consult with a financial advisor before making trading decisions.

Break and retest of ATH's for AMZN?🔉Sound on!🔉
Thank you as always for watching my videos. I hope that you learned something very educational! Please feel free to like, share, and comment on this post. Remember only risk what you are willing to lose. Trading is very risky but it can change your life!
