#AMZN#
Amazon currently holds a 'B' rating (63.49%) and has shown strong performance over the past 12 months with a return of 23.35%. This outperforms the S&P 500 by 37.4 percentage points, which has a return of -14.05%. Financially, Amazon exhibits strong indicators including earnings per share (EPS) of 53.6744, net profit per share of 1.9452, operating cash flow per share of 6.9418, and free cash flow per share of 1.6393. Notable data includes cash per share of $6.2167, book value per share of $17.7265, tangible book value per share of $15.5225, shareholder equity per share of $17.7265, and interest-bearing debt per share of $13.4218.
Recent news highlights a 71% increase in Amazon's stock price this year, bouncing back from a 50% drop in 2022. Q3 financial results exceeded most analysts' expectations, with revenues reaching $143 billion, a 13% year-over-year increase. Despite AWS revenue falling short of expectations, Amazon's dominance in burgeoning sectors like e-commerce and cloud computing makes it an attractive investment. The current price-to-sales ratio is below the 10-year average, indicating a recovering real estate market.
Additionally, Amazon has established a strategic partnership with Moderna Automotive Group, starting online car sales from 2024. Customers can buy cars through Amazon's platform and choose local dealer delivery or pickup. This partnership positions Amazon as Moderna's digital transformation partner, leveraging AWS cloud services, and introduces in-car Alexa by 2025. The deal bolsters Amazon's dominance in AWS cloud computing and creates new potential revenue streams.
Technically, Amazon has re-entered an upward channel, with daily RSI and CCI indicators showing no oversold signals. This suggests market expectations of a price increase. Strong support is evident at the S1 level, indicating a short-term target (T1) for a quick test at $160. In summary, Amazon's future prospects seem bright, and it is recommended for mid-term investment portfolios.
Entry price: $135-150
T3: $196
T2: $170
S1: $140
S2: $134
S3: $125
AMZNCL trade ideas

AMZN LongLevels and Targets for AMZN
Remember Zones defined here will be acting as support or Resistance...So book your Profit accordingly
Please consult your financial advisor before investing
All research is for educational purposes only.

✅AMAZON SHORT FROM RESISTANCE🔥
✅AMAZON has been growing recently
And the stock seems to be locally overbought
So as the price has approached a horizontal resistance of 147$
Price fall is to be expected
SHORT🔥
✅Like and subscribe to never miss a new idea!✅

$AMZN Inverse Head & Shoulders PatternThe stock of Amazon.com, Inc. ( NASDAQ:AMZN ) is currently exhibiting an inverse head and shoulders pattern, a noteworthy development in technical analysis that often signals a potential bullish reversal. For this pattern to be confirmed, it is essential for NASDAQ:AMZN to achieve and sustain a weekly close above the neckline of this formation.

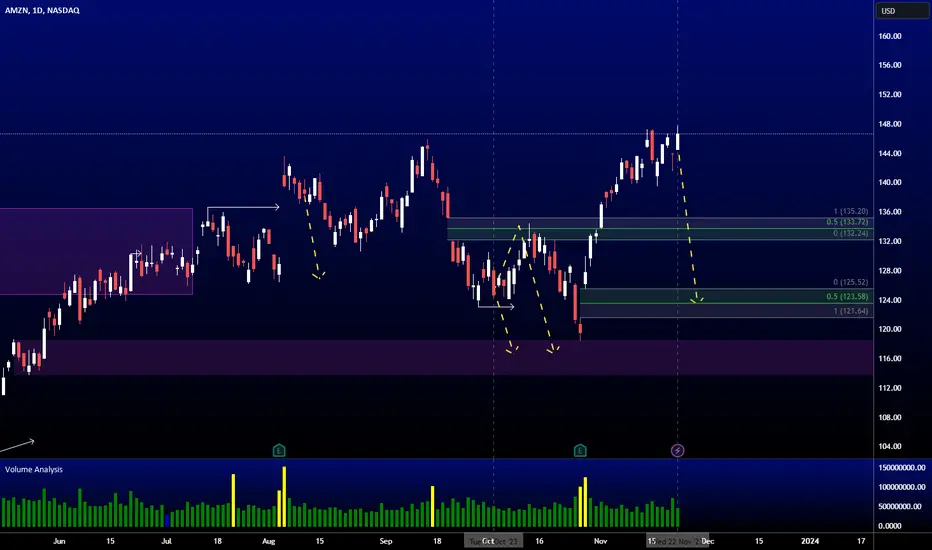
AMZN AnalysisPrice played out nicely according to my last analysis. Price rallied +7.83% into the FVG at 133.72 which then played out nicely to my expectations again into the daily OB at 118.60, giving us a nice -11.99% move to the downside. Price then respected the daily OB and made a clean move to the upside, giving us a +24.83% move. From here, price is starting to lose momentum, and I'm expecting a bearish retracement from here into the discount level.
AMZN - Time to LONG ?AMZN long term profit ?
A popular stock + Cup & Handle pattern + Good fundamental details + Above the average line 150. Only an idea and not a recommendation for trading!

Amazons future looks to be coming to a closeIts a very tough market to predict with so many economic issues going on in todays world.
I took a chance on this company and held for a long time until recent years.
Cashing out was the smartest decision at the peak of such a long rally.
Nobody is expected to hold forever. Jeff Bezos was cashing out and officially stepped down
so that should of been a signal for everyone to start selling. The future looks dim and overall
confidence in the growth of this company moving forward into 2030's is a big NO...
So the big question is whats next. Will they expand into a new area of the market "possible"
Much debate on the future of Amazon. It got so big and people are cashing out on the gains.
I will be watching for some announcement mid 2024 to mid 2025.

Early signs Amazon bear market continuation. Bitcoin RiseLooking at the overbought stock market Amazon Nvidia and so many others.
A huge money flow wave is about to hit the crypto markets.
Bitcoin
Ethereum
Algorand
and so many other crypto assets.
This is not a prediction.
This is fact.
Do your research and make sure you invest wisely. Manipulating bears have
been speaking loudly to cause fear.
Algorand is the most undervalued token in the crypto market today.
Trust me it is a hot investment right now.
Bitcoin and Ether is dominate but don't put all your eggs in one basket.
Diversify.
I put 1000.00 to 100,000 in each crypto investment i choose.
Bitcoin and Ethereum i trade like gold. Long term investments with large capital.
Don't lose your gains if that resistance is realized. Amazon chart is scary right now.
Nvidia chart is scary too. Good luck

AMZNNASDAQ:AMZN
Target green
Stop Loss red
potential inverse head and shoulders pattern here, I have measured the potential target!
GL

Black Friday Buzz for AMZNThe Giant of e-commerce and AWS for small businesses, which now has AI integrated, is moving up in anticipation of a strong Black Friday for $NASDAQ:AMZN.
The new CEO who took over form Jeff Bezos is doing a good job. As the CEO of the AWS division, he did an amazing job building that division of AMZN. Outstanding CEOs make a company great. CEOs are more important than most investors realize.
Weekly Chart shows that AMZN is about 40 points from its all-time high, so plenty of opportunity for it to move up further from here. The Blue lines indicate levels where Dark Pool buy zones and Pro traders moved in most heavily. These are now strong support levels for the stock.

AMZN: Buy ideaBuy idea on AMZN as you see on the chart because we have the breakout with force the resistance line by a big green candle follow by a large green volume.Thanks!

AMZN Daily Bat Pattern AMZN has a completed bearish bat pattern that has gone to Target 1 and has come back to entry to form a TYPE 2 entry. We are at a daily level or resistance.
I won't be looking for any positions until price closes below the 141.51 level.

PICK OF THE MONTHAmazon is getting to buy territory, this is a mean reversion trade.
Good buy now with intention of selling at 120?
I expect the price to drop a bit more but bounce back the blue line as is extremely strong support, and the price should make it to the middle line of the band, that is where profit-taking should take place.


AMZ • Amazon.com • XETRA SHORT TF M30#AMZ • Amazon.com • XETRA SHORT TF M30,
TP = 125.10 , SL = 136.16
The trend continues, the nearest support level according to my calculations TP = 125.10

AMZN SHORTS $$$Hi everyone, just here to update you all on what I will be looking for in AMZN next week. Starting on the Weekly we tapped into a key FVG and took BSL many many months ago and have wicked down now near the close of friday. I Have begun looking at opening about 10% of my initial 2% risk per trade. I will add more accordingly based on Monday's opening if given the chance. now on Daily, we have a clear high and as we speak I'm looking for a lower high to confirm! And on the hourly lastly, we have clear breaks of structure in the bear's favor. I plan on holding this til the 140-136 range and scaling out accordingly! god bless and good luck ;)

AMZN SHORTSAs I stated in the picture. AMZN Is hitting a key Weekly FVG. Here i am watching for a 1H, 4H, and 1D swing high with a recent low broken to enter some put options. I will enter and take profits with PDL being taken out. These setups provide between 50-125% profit based on setup and entry. I will continue to update you all as price shoes more confirmation! Like and shoot your questions below!

AMAZON The rally isn't over yet. Still time to buy and profit.Last time we looked into Amazon (AMZN) on October 30, we called a bullish break-out signal, which in two weeks hit our $146.00 target (see chart below):
We zoom out on the 1D time-frame now in order to identify the longer term patterns involved. Based on the 1D RSI which is pricing a Support on the former Lower Highs trend-line, we can see the very same formation on January 18, above the 1D MA50 (blue trend-line). This was also after a break-out above a Falling Wedge, a pattern which formed the market bottom of the Inflation Crisis.
The stock shortly after completed a +39.84% rise and peaked just over the 1.382 Fibonacci extension. As a result, we are now targeting initially 156.50 (1.382 Fib) and early in January 165.00 (+39.84% from the bottom).
-------------------------------------------------------------------------------
** Please LIKE 👍, FOLLOW ✅, SHARE 🙌 and COMMENT ✍ if you enjoy this idea! Also share your ideas and charts in the comments section below! This is best way to keep it relevant, support us, keep the content here free and allow the idea to reach as many people as possible. **
-------------------------------------------------------------------------------
💸💸💸💸💸💸
👇 👇 👇 👇 👇 👇

AMZN approaching hourly oversold for potential daily higher lowAMZN has been a lead bear all morning in the face of market strength and this seemingly endless rally. All along the question has been, what will the market do when names reach their first hourly oversold conditions (Hourly RSI <= 30)? Looks like AMZN could be the first to reach those conditions. So, eagerly watching to see what happens 🍿

Amazon To Sell Hyundai Vehicles OnlineAmazon will begin selling Hyundai vehicles online in the U.S. starting next year, the two companies said on Thursday.
Customers will be able to shop for, equip and buy a car at Amazon.com and schedule delivery through a local Hyundai dealer, the companies said.
The agreement is an expansion of a deal announced two years ago to expand Hyundai's digital showroom on Amazon.com, enabling customers to configure a vehicle, calculate the price and locate a dealer to complete the sale.
Hyundai set up its first digital showroom on Amazon in 2018. The new agreement also will enable buyers of new Hyundai vehicles in 2025 to access Amazon's Alexa voice assistant from their cars.
Hyundai has selected AWS as its preferred cloud provider to accelerate its digital transformation using broad and industry-leading AWS capabilities—from compute, storage, database, and analytics to generative AI and Internet of Things (IoT). As part of a new multiyear agreement, Hyundai will become a more data-driven organization with a cloud-first technology strategy, migrating its current on-premises applications—which support everything across research, product engineering, and customer engagement—to AWS. Hyundai will prioritize business cases like manufacturing and supply chain to help optimize production and minimize costs, security and disaster recovery for resiliency, and connected vehicle development to bring new features to drivers around the globe. AWS and Hyundai have designed and implemented a Master Builder training and certification program to train Hyundai engineers in critical cloud skills.
Technical Analysis
AMZN is trading near the top of its 52-week range and above its 200-day simple moving average.
What does this mean?
Investors have been pushing the share price higher, and the stock still appears to have upward momentum. This is a positive sign for the stock's future value.

AMZN - 19 months HEAD & SHOULDERS══════════════════════════════
Since 2014, my markets approach is to spot
trading opportunities based solely on the
development of
CLASSICAL CHART PATTERNS
🤝Let’s learn and grow together 🤝
══════════════════════════════
Hello Traders ✌
After a careful consideration I came to the conclusion that:
- it is crucial to be quick in alerting you with all the opportunities I spot and often I don't post a good pattern because I don't have the opportunity to write down a proper didactical comment;
- since my parameters to identify a Classical Pattern and its scenario are very well defined, many of my comments were and would be redundant;
- the information that I think is important is very simple and can easily be understood just by looking at charts;
For these reasons and hoping to give you a better help, I decided to write comments only when something very specific or interesting shows up, otherwise all the information is shown on the chart.
Thank you all for your support
🔎🔎🔎 ALWAYS REMEMBER
"A pattern IS NOT a Pattern until the breakout is completed. Before that moment it is just a bunch of colorful candlesticks on a chart of your watchlist"
═════════════════════════════
⚠ DISCLAIMER ⚠
The content is The Art Of Charting's personal opinion and it is posted purely for educational purpose and therefore it must not be taken as a direct or indirect investing recommendations or advices. Any action taken upon these information is at your own risk.

Goog, Amzn Going down.Goog, Amzn Going down.
NFLX Leading the way.
Lower High 61.8%.
Divergence.
3x Target.

AMZN Inverse H&SAMZN has broken the neckline on a nearly 2 year inverse H&S pattern.
Not financial advice, just an observation.
