Amazon - Look At This All Time High Retest!Amazon ( NASDAQ:AMZN ) will create the bottom soon:
Click chart above to see the detailed analysis👆🏻
The trend on Amazon is clearly towards the upside and the recent correction of about -30% did not change that at all. Rather, we are now witnessing an extremely bullish all time high break and retest and therefore, if Amazon actually creates bullish confirmation, this could form a bottom.
Levels to watch: $180
Keep your long term vision,
Philip (BasicTrading)
AMZNCL trade ideas

AMZN trading at 20 year trough forward EV/EBITDA multiplesAMZN is trading at 20 year trough forward EV/EBITDA multiples. Right now that is 10.3x forward EV/EBITDA. For reference, the 20 year average multiple is 18.23. Note the standard deviation lines on the multiple chart on the bottom right indicate that AMZN is trading nearly 2 sigma below the 20 year average multiple.
Only twice in past 20 years has valuation reached these lows: the 2022 market bottom and the 2008 bottom. Both were fantastic entry points.
Note the graph of the forward EV/EBITDA using rolling 2 year forward annual estimates. The yellow arrows on that chart correspond to the dates of the blue arrows on the price chart.
If you want to read the multiple chart more closely, grab the chart and you can make it bigger.

AMZN Weekly Bullish Setup - 91% Historical Win RateI’m looking to go long on Amazon (AMZN) on the weekly chart as the price that has acted this way has been a strong indicator for a swing trade in the past.
Since early 2023, AMZN has climbed from the mid-$70s to a peak above $245, carving out clear impulse moves followed by healthy pullbacks.
The current pullback has returned into the $185–195 region, which on the weekly VP shows the largest volume accumulation (HVN). Historically this zone has marked both places to buy into rallies and logical areas to defend.
We were in a 5 week range. Last week printed a bullish rejection candle (long lower wick), accompanied by my weekly “buy” arrow (green triangle). This mirrors 34 prior occurrences of the same pattern on AMZN’s weekly chart.
Targeting the $240 region, this is a 1:1 trade
Pull Back is RequiredAMZN Sell Setup - GETTEX:AMZ
Bearish Momentum on Daily Chart
Instrument: AMZN
Timeframe: Daily
Direction: Sell
Confidence: 75%
Setup Overview:
AMZN is showing bearish signals after a recent pullback. MACD has a bearish crossover, and RSI is overbought at 61.25, indicating potential for a downward move. VIX is rising, and 10-year yields are increasing, adding to market pressure. Social sentiment on X is mixed, but news sentiment leans bearish.
Trade Details:
Entry Price: $198.82
Profit Target: $182.23 (~5% downside)
Stop Loss: $205.61 (2:1 risk-reward ratio)
Position Size: 4% of portfolio
Expected Move: -5%
Key Indicators:
MACD: Bearish crossover
RSI: Overbought at 61.25
Market Context: Rising VIX, increasing 10-year yields
Follow for Best AI Signals on the market

AMZN at a Decision Point – Compression Before the Pop?Let me walk you through what I’m seeing on AMZN right now — because this thing has been quietly setting up, and I’ve got my eyes locked on a few key levels.
🧠 My Current Read on the Chart
From the daily timeframe, AMZN has clearly been in a falling channel since the Feb highs, but recently it’s been trying to base out. Price got a clean breakout of that downtrend, followed by a decent bounce, but the last few candles show we’re kind of stalling right around $185 — that level is acting like a magnetic midpoint.
On the 1H timeframe, it's just consolidating right under the Gamma Wall at $190, bouncing between $185 and $188 for several sessions. That tight price action looks like it's coiling.
MACD on the 1H is slightly turning up but still muted. The Stoch RSI on both timeframes is sitting in the midzone — not screaming momentum yet, but could flip fast with volume.
📊 What GEX and Options Flow Are Telling Me
Now here’s where it gets spicy: GEX levels are stacked. $190 is the highest positive Net GEX zone — that’s our big call resistance, and market makers are most likely short calls there. If price can chew through that level with strength, we could see a fast gamma pop toward $193–195.
Below current levels, $182.5 is the HVL and also lines up with a strong put wall (86%). That’s the real defensive level — if that breaks, it could attract liquidity lower into the $180–$175 zone.
IV rank is low at 27.7, and we’ve got a slight negative IVx trend (-8%), meaning the premiums are getting cheaper — good time to consider debit strategies.
💡 How I’d Play This Personally
1. Bullish case (breakout over $190):
I’d look at $190/$195 call debit spreads, especially with 3–10 DTE, keeping it defined risk while targeting that gamma extension.
2. Choppy zone (stuck between $185–$190):
I’m on watch mode. I wouldn’t touch directional plays unless I see a breakout or breakdown. Theta decay will eat you up in this range.
3. Bearish flush (lose $182.5):
I’d grab some quick puts targeting $177–$175, but only if we get momentum + a weak market. That zone opens the door for downside liquidity.
🧭 Final Thoughts
AMZN’s been under the radar while everyone watches AI names, but I think this thing is about to make a move — it’s just a matter of whether the breakout gets the volume push. Personally, I’m waiting for that clean trigger over $190 with some momentum before jumping in.
Keep your levels tight, watch that GEX wall, and don’t chase the chop. Let the setup come to you.
This is not financial advice, just how I’m looking at it based on my system and experience. Trade smart. 🙏

Amazon remains a dominant force in e-commerce and cloud**Direction:** **LONG**
**LONG Targets:**
- **T1 = $195.80**
- **T2 = $199.00**
**Stop Levels:**
- **S1 = $188.00**
- **S2 = $185.00**
**Wisdom of Professional Traders:**
This analysis synthesizes insights from thousands of professional traders and market experts, leveraging collective intelligence to identify high-probability trade setups. The wisdom of crowds principle suggests that aggregated market perspectives from experienced professionals often outperform individual forecasts, reducing cognitive biases and highlighting consensus opportunities in AMZN.
**Key Insights:**
Amazon remains a dominant force in e-commerce and cloud computing, but growth concerns have recently pressured its stock. Professional traders emphasize the importance of AWS (Amazon Web Services) as a growth driver, despite recent performance discrepancies compared with competitors like Microsoft Azure. Technical traders also note that Amazon is consolidating around key support levels, with reduced implied volatility that could indicate forthcoming price stabilization or upward momentum. Sentiment is mixed, but traders are gearing up for possible resilience given potential catalysts.
**Recent Performance:**
Amazon’s stock has seen a gradual recovery from prior declines earlier this year. Still, the stock remains 13% lower year-over-year compared to a modest 3% decline in the S&P 500. This muted performance reflects concerns around short-term macroeconomic challenges, such as slower growth in AWS and tariff changes. The recent price movement indicates a trading range and decreased volatility, suggesting less aggressive downside selling.
**Expert Analysis:**
Expert opinions signal Amazon remains structurally intact with a strong long-term outlook, although short-term headwinds persist. The cloud segment moderation is highlighted as a key challenge, but analysts remain optimistic with broader revenue trends, including Amazon's diversification initiatives into healthcare and logistics. In technical trading terms, a break above the $192 resistance zone may confirm bullish momentum, while a breach below $185 could signal further weakness.
**News Impact:**
News surrounding tariff adjustments and Amazon’s ambitious but high-cost Project Kuiper dominate recent headlines. Import tariff changes impact margins, but traders see efforts to roll out satellite-based internet projects as a testament to Amazon's innovation drive. Satellite deployment challenges may take the spotlight away from near-term earnings performance, adding speculation on long-term growth factors.
**Trading Recommendation:**
Amazon's recent consolidation near its support zone and technical signals indicate a favorable long setup for traders anticipating a breakout above $192. Focus on maintaining stop levels diligently and adjusting targets if momentum shifts unexpectedly. Long-term fundamentals remain supportive, reinforcing confidence in growth as risks moderate over time.

AMAZON I Technical Forecast Welcome back! Let me know your thoughts in the comments!
** Amazon Analysis - Listen to video!
We recommend that you keep this pair on your watchlist and enter when the entry criteria of your strategy is met.
Please support this idea with a LIKE and COMMENT if you find it useful and Click "Follow" on our profile if you'd like these trade ideas delivered straight to your email in the future.
Thanks for your continued support!Welcome back! Let me know your thoughts in the comments!

AMZN Earnings CallMarket Analysis
Looking at Amazon GETTEX:AMZ ahead of today's critical earnings announcement, I've identified a compelling pre-earnings call opportunity. Amazon is set to report its Q1 earnings after market close today, with Wall Street expecting revenue of $155.2 billion and EPS of $1.37, representing a 39.6% year-over-year growth in earnings.
Instrument Details:
NASDAQ:AMZN May 2, 2025 $207.50 CALL
Entry: $0.80
Target: $1.60 (100% gain)
Stop-Loss: $0.40 (50% risk)
Position Size: 1 contract
Entry Timing: Pre-earnings close (Today)
Technical Rationale & Market Context
Current market sentiment data for Amazon shows a positive news sentiment score of 0.72 (on a scale from -2 to 2), though short interest has recently increased slightly by 0.66%, indicating some growing caution among investors. GlowRoad Amazon has several potential positive catalysts in play, including its recent announcement of a $4 billion investment to build out its delivery network across rural areas by 2026, which could accelerate growth in previously underserved markets.
What makes this setup particularly attractive is the unusually high IV rank of 0.75, indicating significant options premium inflation ahead of earnings, combined with Amazon's strong performance last quarter where it delivered a substantial 25.14% earnings surprise ($1.86 EPS vs $1.49 estimated).
Risk/Reward Analysis
With an expected post-earnings move of 9.22%, our position has a favorable risk/reward profile:
Maximum profit: 100% ($0.80 to $1.60)
Maximum loss: 50% ($0.80 to $0.40)
Confidence level: 65%
Breakeven: AMZN needs to rise above $208.30 by expiration
Catalysts & Exit Strategy
The primary catalyst is tonight's earnings report after market close. I expect the current momentum to continue if:
AWS (Amazon Web Services) growth exceeds expectations
Retail margins show further improvement
Forward guidance is strong despite tariff concerns

AMZN Might Be Waking Up Here’s What I’m Seeing Across Timeframes 📈🔥
I’ve been tracking AMZN closely, and I want to lay out how I’m thinking through this setup using both the daily and 1-hour charts — plus how options flow might come into play this week. Also worth noting: today’s Trump meeting with investors could give broader market sentiment a lift, especially for big tech like AMZN, so I’m factoring that into how I approach this week.
Daily Chart – Big Picture Structure (1D):
On the daily, AMZN is still technically inside a descending channel. Price made a solid bounce recently, but it hasn’t broken out of the upper boundary yet. That resistance zone around $191–$194 has acted like a ceiling. If we can get through that, it could shift the whole structure.
That said, the MACD has crossed bullish, and Stoch RSI is curling back up. So there’s definitely some underlying strength trying to build. I’m thinking this isn’t the moment to go all-in long just yet, but it’s close — a clean breakout above $191 could open up that move toward $197 or even $200.
1-Hour Chart – Where I’m Dialing In (1H):
The 1-hour chart has been super helpful to frame my short-term bias. Price held the trendline beautifully after pulling back to the ORL zone around $180. We’ve been seeing higher lows and a grind back into the $187–$191 range.
What I like here is that the bounce was orderly. MACD’s going flat now, so we might just be consolidating before another push. If we can take out that $191 level — which lines up perfectly with gamma resistance on the options side — I’d expect momentum buyers to come in fast.
Options Flow (GEX & Gamma Zones):
Looking at the GEX data, the key level I’m watching is $191. That’s where the gamma shift happens — if price gets above that and holds, the dealer positioning could actually help accelerate the upside move. Above that, there’s a cluster of call walls at $195, $197.5, and $200. Those areas could slow things down, but also act as magnets if buyers step in.
To the downside, $180 is where I’m watching for support — both technical and from put walls. If AMZN drops back below $182.5, I’d be cautious and expect a fade toward $175 or lower.
How I’m Thinking Through the Week:
This setup is all about timing. If AMZN can ride the market mood — especially with Trump’s investor meeting today possibly boosting confidence — I could see it clearing $191 and pushing toward that $195+ range. In that case, I’d look at calls or debit spreads, probably with a 1–2 week window.
But if we stall again under $190 and lose $185, I’d flip bearish short-term and consider a quick fade to $180–$178 using puts or tight vertical spreads.
Wrapping Up:
I don’t think we’re in breakout territory yet on the daily — but it’s close. The 1H chart looks constructive, and the GEX data supports both a squeeze above $191 and strong support near $180. If Trump’s meeting sparks broader buying, AMZN could catch that tailwind.
Let’s see how we open — I’m staying flexible but ready to act.
Disclaimer: This is not financial advice. Just sharing my thoughts and how I’m approaching the trade using technicals and sentiment. Always manage your risk and have a plan.

AMZN | Long | Earnings + Buyback Potential | (April 2025)AMZN | Long | Earnings + Buyback Potential | (April 2025)
1️⃣ Short Insight Summary:
Amazon is showing strength as it bounces off the VWAP level. With earnings approaching and a history of buybacks, the setup looks promising for a rebound after months of decline.
2️⃣ Trade Parameters:
Bias: Long
Entry: Around $196
Stop Loss: Below VWAP support (adjust to your risk)
TP1: $205
TP2: $217
TP3: $240
Partial Exits: 50% around major resistance zone near TP1–TP2
3️⃣ Key Notes:
AMZN has been trending down since February but is now reacting positively. The upcoming earnings could be a bullish catalyst, especially if there's a buyback announcement. Earnings per share and revenue have been strong. Watch for reaction at key resistance levels, and track the broader market sentiment (especially QQQ/NQ correlations).
4️⃣ Follow-up Note:
Will revisit post-earnings to assess if momentum continues and whether to adjust targets or re-enter.
Please LIKE 👍, FOLLOW ✅, SHARE 🙌 and COMMENT ✍ if you enjoy this idea! Also share your ideas and charts in the comments section below! This is best way to keep it relevant, support us, keep the content here free and allow the idea to reach as many people as possible.
Disclaimer: This is not a financial advise. Always conduct your own research. This content may include enhancements made using AI.

AMZN HEADING INTO MAY 25;FAKE OUT, OR BREAK OUT?
Definitive down trend confirmation since topping in late JAN and then a hard rejection and move down in MID FEB.
I believe we have a bottom in early April and are beginning to set a new trend up, but could be a fake breakout and continuation of Down trend.
PREVIOUS NOTE (LISTED ON CHART from MID FEB)
RED HORIZONTAL LINE
"2021 resistance HEAVY. Now could be HEAVY support?
Down trend continues on close below red horizontal line.
Keep going to re-test rectangle.
Double confirmation above higher down trend line signals reversal to retest $218.50 up at"
New potential channel has it trying to break above that red line and rejecting slightly..
rebound this week and close above red horizontal??
OR
Head down to $171-172.50 range to test bottom of potential new channel.
For now.. WAITING to see what this week brings
Checking for next week right before fed meeting, trade deals being announced etc. Big impact on Amazon
NUETRAL.
Would love to hear thoughts.
DISCLAIMER:
This is not for TRADING
This is specifically for DCA in @ solid buy levels building portfolio over time long term.
Last purchase @ $165.50 on dip.
Looking for next entry.

TWAP and Chaikin's Osc vs VWAP Orders and VWAP IndicatorThere are two primary Order Types that the Professional Side of the market use.
1. Time Weighted at Average Price, aka TWAP , is used extensively by the Dark Pool Buy Side, Derivative Developers, and Sell Side Banks of record for Buybacks for corporations.
The TWAP can be set at a penny to few pennies spread and pings and transacts on a specific TIME to PRICE. It can be set to time intervals shorter or longer. This is why the stock market is called "fully automated".
TWAP is used most of the time. It is rare for the Giant Institutions to use VWAP orders due to the May 2010 FLASH CRASH when a fundamental trader of e-minis accidentally hit the VWAP order type rather than the TWAP order type which caused a massive collapse of all stocks as VWAPs accelerate selling as volume increases.
2. Volume Weighted at Price or VWAP is ALSO an ORDER TYPE. It is primarily used by Small Funds Managers and Small Asset Managers who are independents trading their customers' investment money actively, often intraday. Volume Weighted at price ORDER TYPES are also automated and ping to trigger the order to transact as volume increases.
This is an easy, simple way for a busy small fund manager to cope with the complexity of buying and selling stocks with 10,000 share lots to 100,000 share lots. These are the NEW "whales" of the market.
Professional Traders Swing trade 1 million to 5 million or higher share-lot sizes. The size of the orders of the professional trader has increased significantly in the past decade.
All of you need to be aware of the market participants on the professional side as they control 80% of the 1 trillion dollars that exchange hands daily on the US Markets.
Using Chaikin's Oscillator is ideal for tracking the Dark Pool Buy Side who create the bottoms. This excellent indicator analyzes all 3 data sets: price, volume and time. Thus, it can signal early that the Dark Pools have slowly started to accumulate over time and the runs down will turn into a bottom and then pro traders will nudge price to inspire VWAP orders from the Smaller funds managers.
The VWAP INDICATOR is excellent for tracking the smaller funds managers' trading activity and it ALSO has price, volume, and time in the formula. So this is great for those of you who need an indicator for following smaller funds activity as these smaller funds VWAP orders trigger more and more volume and then runs that can move up or down for several days.
TradingView has an awesome group of indicators to use. You should customize your indicators to which market participant groups you wish to track so that you can be ready and in a position before the big runs up or down.
Trade Wisely,
Martha Stokes CMT

AMZN Weekly EntriesI am looking how to either delete a public publish or if I can just update it weekly


AMAZONAmazon has a great potential to head up towards 230 level.
Disclosure: We are part of Trade Nation's Influencer program and receive a monthly fee for using their TradingView charts in our analysis.

Volume Predicting Reversal. Trend line is established by second volume bar being within 45 degrees above or below previous bar high. The trend line is broken up first bar that forms at a greater than 45 degree angle (up or below) than last volume bar in trend.
One can confirm trend reversal by looking at candles that correspond to volume bars that indicate a trend reversal (greater than 45 degree angle from previous volume bar).

Amazon look interestingAmazon has a short target price around 202 then may have drop to be around 180 (240 min cycle). However, this dropping looks interesting for targeting long term price, which may up to 233 (2-3 months). By the way the above price may disappear if the price drop less than 165.
The strategy is waiting for buying after dropping from testing a resistant at 202$.
More important, it should be bought after it has a reversal candle.

AMAZON Buy IDEAAmazon has entered buy zone
New Higher highs are being painted
Previous support has sustained
Over all TRUMP s U turn on terrifs has paved way for recovery of Us companies.

What Amazon’s Chart Says Ahead of Next Week’s Earnings ReportAmazon NASDAQ:AMZN has been reducing its exposure to U.S. tariffs on Chinese imports recently, and is also possibly slowing down its AI-related infrastructure purchases as the online-retail giant prepares to report Q1 earnings next week. What does fundamental and technical analysis say could happen next for the stock?
Let’s check it out:
Amazon’s Fundamental Analysis
AMZN plans to release its earnings after the bell next Thursday (May 1) in the middle of an interesting period for the company.
Published reports recently indicated that Amazon has been canceling orders from some Chinese vendors in a bid to avoid the Trump administration’s new 145% tariffs on the Asian nation’s goods.
After all, Amazon would be the "importer of record" for items purchased at the wholesale level, and that’s who actually gets Uncle Sam’s tariff bills.
Of course, the tariff situation remains murky, as the Trump administration appeared this week to seek a de-escalation of its trade wars with China and other countries.
Meanwhile, Wells Fargo this week released a research note implying that Amazon could possibly become the second hyper-scaler to slow down on AI-related infrastructure purchases.
The report posited that AMZN has put some leasing discussions for the co-location of its data centers on hold. If true, that would make Amazon the second hyper-scaler to ease AI-focused capital-expenditure spending, following the lead of its key cloud competitor Microsoft NASDAQ:MSFT .
However, TD Cowen published its own research note on Monday that offered a potentially different explanation of what's going on at Amazon.
Cowen agreed that AMZN has been walking away from some co-location deals, but argued that the change stems from Amazon shifting to a preference for operating its data centers on company-owned properties.
Cowen noted that Amazon “continues to move ahead with powered shells and self-builds." The firm also pointed out that other major hyper-scalers Meta Platforms NASDAQ:META , Alphabet NASDAQ:GOOG NASDAQ:GOOGL and Oracle NYSE:ORCL haven’t shown any signs of slowing down their collective appetite for securing increased capacity through co-location.
In fact, Amazon CEO Andy Jassy recently wrote in his annual letter to shareholders that generative AI “is going to reinvent virtually every customer experience we know and enable altogether new ones about which we've only fantasized.”
He also said that’s why Amazon’s Amazon Web Services cloud business is “quickly developing the key primitives (or building blocks) for AI development.”
Jassy said those efforts includes such things as “custom silicon AI chips in Amazon Trainium to provide better price-performance on training and inference, highly flexible model-building and inference services in Amazon SageMaker and Amazon Bedrock, our own frontier models in Amazon Nova to provide lower cost and latency for customers’ applications and agent creation and management capabilities."
Hmm, does that sound like a CEO who’s cutting back on AI investment? Not to me.
Jassy did say that chips or GPUs are the reason why Amazon’s AI investments are so expensive, but added that those costs should be headed lower in the future.
Why? Because the firm's own Trainium2 chips offer performance that is 30% to 40% better in some ways than what the firm is purchasing from exterior providers.
That might not be so great for Nvidia NASDAQ:NVDA , but it doesn't sound like a problem for Amazon.
All in, the Street is looking for Amazon to report about $1.36 of Q1 GAAP earnings per share on roughly $155 billion of revenue.
That would represent a 38.8% EPS gain compared to the company’s year-ago results of $0.98, as well as more than 8% y/y growth in revenues.
While many investors would view such year-on-year growth as reflecting a solid quarter, that would also mark a deceleration of growth rates for Amazon. After all, the company hasn’t seen less than 8.5% y/y sales growth for any single quarter since Q2 2022.
I also don't know if Amazon will issue any forward guidance given our current environment of unclear tariff policies.
Amazon’s Technical Analysis
Now let’s check out AMZN’s chart going back some seven months:
Readers will first see a sloppy-looking “head-and-shoulders” pattern that formed over recent months, marked with purple boxes above. That appeared to point to a bearish reversal.
In fact, that’s exactly what happened to Amazon, leading to a sell-off that bottomed out in early April at close to $161.
But interestingly, this pattern seems to have since morphed into a potentially bullish small “double-bottom” pattern (the black diagonal lines at right) that shows a $191 pivot at its conclusion. (AMZN was trading at $186.92 Friday morning.)
Amazon also appears to have suffered a so-called "death cross" in recent days without being adversely impacted.
A “death cross” occurs when a stock’s 50-day Simple Moving average (or “SMA,” marked with a blue line above) crosses below its 200-day SMA (marked with a red line above). This is historically a bearish signal -- but anecdotally, I’ve noticed that to be true less and less often with stocks of late.
Meanwhile, readers will notice that Amazon’s Relative Strength Index (the gray line at the chart’s top) is neutral, although rising.
Separately, the stock’s daily Moving Average Convergence Divergence indicator (or “MACD,” marked with gold and black lines and blue bars at the chart’s bottom) is postured rather bullishly.
True, Amazon’s 12-day Exponential Moving Average (or “EMA,” marked with a black line) and 26-day EMA (the gold line) are both below zero. That’s historically a bearish signal.
But on the positive side, that 12-day line is above the 26-day line, which is typically bullish. The histogram of Amazon’s 9-day EMA (the blue bars above) has also moved above the zero bound, which is also often a bullish sign.
(Moomoo Technologies Inc. Markets Commentator Stephen “Sarge” Guilfoyle had no position in AMZN at the time of writing this column.)
This article discusses technical analysis, other approaches, including fundamental analysis, may offer very different views. The examples provided are for illustrative purposes only and are not intended to be reflective of the results you can expect to achieve. Specific security charts used are for illustrative purposes only and are not a recommendation, offer to sell, or a solicitation of an offer to buy any security. Past investment performance does not indicate or guarantee future success. Returns will vary, and all investments carry risks, including loss of principal. This content is also not a research report and is not intended to serve as the basis for any investment decision. The information contained in this article does not purport to be a complete description of the securities, markets, or developments referred to in this material. Moomoo and its affiliates make no representation or warranty as to the article's adequacy, completeness, accuracy or timeliness for any particular purpose of the above content. Furthermore, there is no guarantee that any statements, estimates, price targets, opinions or forecasts provided herein will prove to be correct.
Moomoo is a financial information and trading app offered by Moomoo Technologies Inc. In the U.S., investment products and services on Moomoo are offered by Moomoo Financial Inc., Member FINRA/SIPC.
TradingView is an independent third party not affiliated with Moomoo Financial Inc., Moomoo Technologies Inc., or its affiliates. Moomoo Financial Inc. and its affiliates do not endorse, represent or warrant the completeness and accuracy of the data and information available on the TradingView platform and are not responsible for any services provided by the third-party platform.

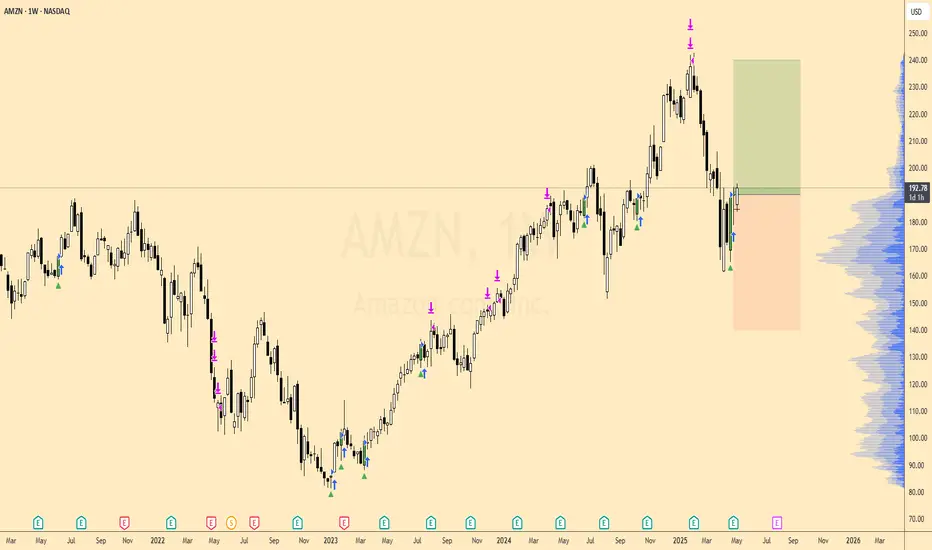
Amazon Wave Analysis – 24 April 2025
- Amazon reversed from support zone
- Likely to rise to resistance level 192.00
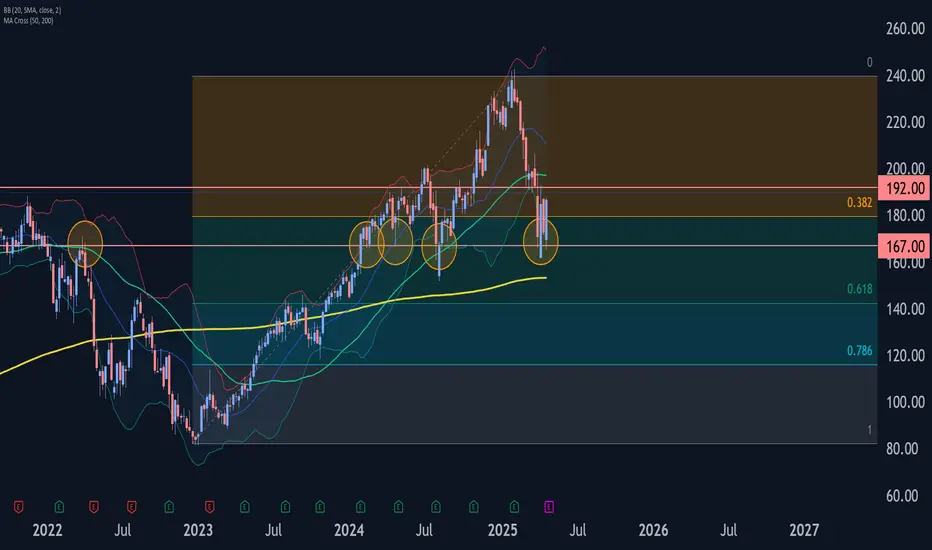
Amazon recently reversed up sharply from the powerful support zone between strong support level 167.00 (which has been reversing the price from the start of 2024), lower weekly Bollinger Band and the 50% Fibonacci correction of the uptrend from 2022.
The price is currently forming the second consecutive weekly Japanese candlesticks reversal pattern Bullish Engulfing.
Given the clear weekly uptrend and the oversold weekly Stochastic, Amazon can be expected to rise toward the next resistance level 192.00.
AMZN - Melt up & Crash series [5 - Final]I believe the path is extremely clear now.
Top around end of June
This will be my final prediction given the new price points
Not financial advice

AMZN Option Trading + TA Outlook – April 23, 2025
📊 GEX Option Sentiment
Amazon (AMZN) is pushing into a key gamma resistance zone, testing 180–185 — where the highest positive NET GEX and stacked call walls are sitting. These zones often act as friction areas where dealers may hedge more aggressively, slowing upside or even causing a fade. Support is reinforced near 165–167 by the HVL and PUT wall.
* Key Resistance: 180 / 185 → Top of call wall stack
* Support Zone: 165.29 → HVL and highest PUT support
* IVR/IVX: IVR 59.9, IVX avg 53.8 → Elevated, with room for continuation
* Options Flow: Bullish skew with only 6.1% in puts → Dealers tilted long
* Bias: Bullish, but approaching resistance = expect stall/fade or measured breakout
🎯 Option Play Idea
If price consolidates above 180, consider 185C or 190C lottos with tight stop below 176 (gamma slip zone).
If rejected below 180 with weakness, consider a put vertical 180/170 for premium capture into support.
📈 Price Action + SMC Structure
Trend structure has turned bullish after reclaiming structure with BOS and higher lows. Current rally is testing the supply zone and previous CHoCH area around 179–180. SMC bias is green across timeframes with strong DMI and RSI confirmation.
* Market Structure: Bullish Hold, but in premium zone — we’re near resistance
* Entry Confirmation: Price must hold above 175.93
* Targets:
* T1: 187.7
* T2: 195.58
* Invalidation: Break below 173.32
* Volume Watch: Thin volume in trend → Watch for strength continuation or stall
💡 My Thoughts
This is a high-conviction continuation setup — but it’s happening directly below a heavy gamma wall and supply zone. That means timing and confirmation are everything. I wouldn’t chase the move blindly here — instead, wait for a clear breakout and retest of 180 or a pullback to 175 for a safer entry.
We’re likely to see volatility increase into earnings and dealer hedging shift fast — especially with IV already climbing. Be tactical, and don't overstay the move.
This analysis is for educational purposes only and does not constitute financial advice. Always do your own due diligence and manage risk accordingly.

Amazon longFundamental picture:
- Current price 173 with P/E 31 (10Y low)
- Implied price 405 with average P/E 80
- Expert price 267 (TipRanks)
Technical picture:
- Near Fibonacci extension limit of VWAP 200D
- Near ATR Yearly Limit
- Near 20Y Channel since 2001
Entry:
- 170
- 150
- 130
Target:
- 200
- 300
- 400
- 700
Stop:
- < 130 = PoC 2Y
