Post FOMCI still believe this market will drop to 5400-5300 area by next week. If I'm wrong so be it, but I go through my reasoning in the video.
AMZNCL trade ideas

Amazon Back to 2021 Highs – A 1/6 Risk-Reward SetupYes, Amazon doesn’t look great here—but let’s put it in perspective.
Imagine holding the stock from this exact price in 2021, watching it trade 20% higher in February 2025—would you sell here?
For now, I’m watching $189—if it can’t break below, the risk reward is even better.
📌 Stop: 5 points from here
🎯 Target: $230
Let’s see if the 189 level holds. 🚀

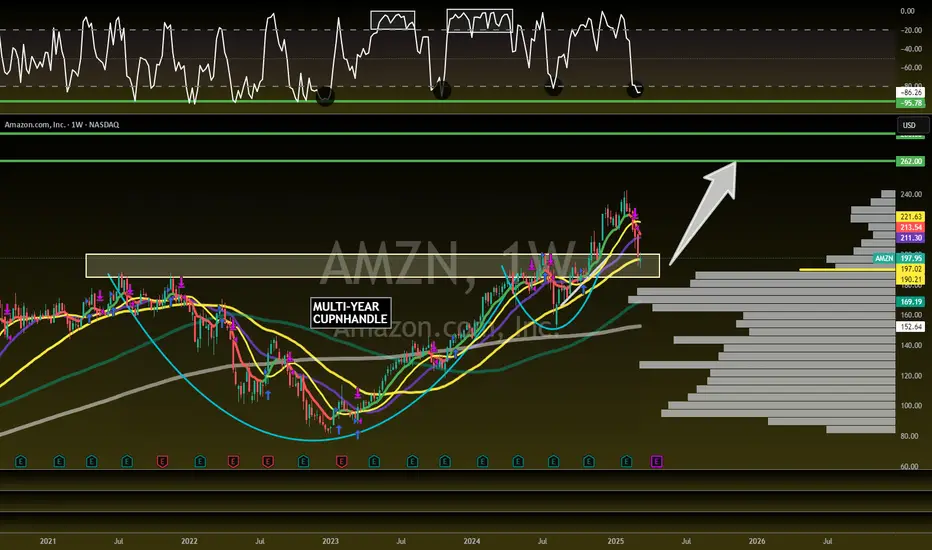
Amazon is the FULL PACKAGE! 62% UpsideNASDAQ:AMZN - H5_W Trade Setup: 🚨
Confirmed CupnHandle Retest =
🎯$262 🎯$280
📏MM: $310
- Multi-Year CupnHandle
- Massive weekly volume shelf
- Green Support Beam on Wr%
- Undervalued MOAT Company
Not financial advice

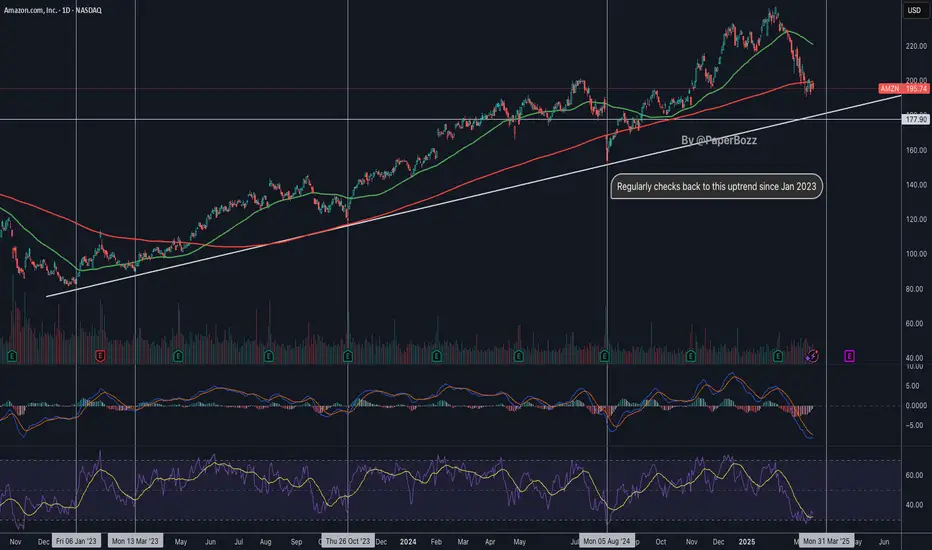
$AMZN - revisit to the trendline likely NASDAQ:AMZN consistently revisits the uptrend line that began in January 2023. There’s a strong possibility it could do so again.
The $180 area could be a good entry point.
AmznHeaded back to 180 price action and trendline support but first a push back to 208-210 (20ma) + theres a gap to close from March 5th
I don't think price makes it back over 210 before it take a turn down to 180 BUT if price can close above 211, then we are headed here
215 price action + the weekly 20ma at 217 .. that my extreme long target that will only come if Spy pushes back up to 580-585..
But we are headed back to 180 and this is perfectly normal!
The very bearish scenario is if Amzn breaks 180.. then 140 comes
So let's talk about trading this
Daily 200ma is at 199.. price action resistance is at 200.00
Long over 201.00
Target - 208-210
Stop loss below 197.00 weekly 50ma
Short only if price breaks back under 195
Target 191
Stop loss
197.50
197-199 is chop... No trade zone

AMAZON SWING LONG FROM SUPPORT|LONG|
✅AMAZON fell again to retest the support of 190.79$
But it is a strong key level
So I think that there is a high chance
That we will see a bullish rebound and a move up
LONG🚀
✅Like and subscribe to never miss a new idea!✅
Disclosure: I am part of Trade Nation's Influencer program and receive a monthly fee for using their TradingView charts in my analysis.

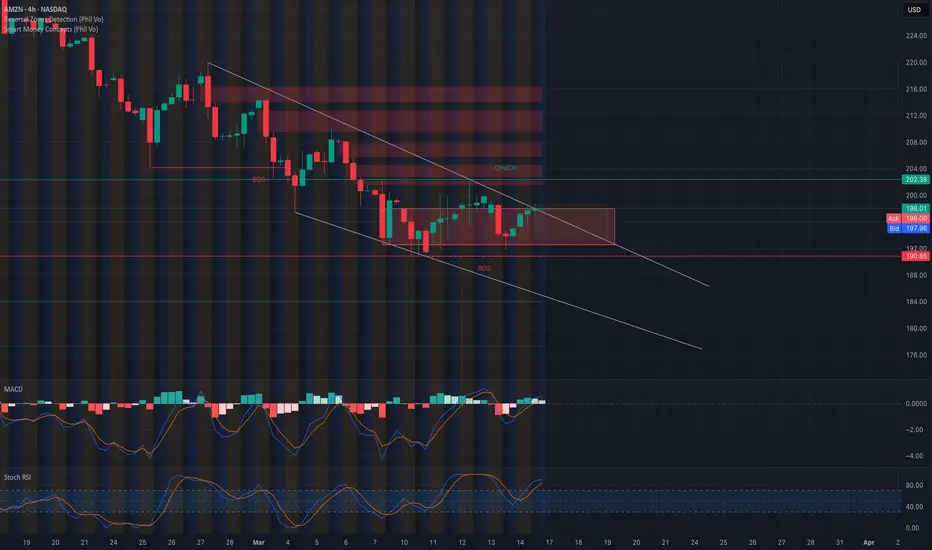
AMZN Sitting at a Make-or-Break Level! Watch This Closely. Mar17Hey team! Quick AMZN update based on the 4-hour chart setup.
📈 Technical Analysis (TA):
* AMZN is flirting with the top trendline of a descending wedge pattern—could hint at a bullish breakout.
* Crucial resistance zone immediately overhead between $198–$202; breaking this zone could ignite upward momentum.
* Recent BOS (Break of Structure) at $190.85 highlights strong support—this is a key area for bulls.
* Keep an eye on the supply zone around $202.38 if the breakout continues.
📊 GEX & Options Insights:
* Highest positive NET GEX and call resistance at $210; major gamma wall that could act as a price magnet if AMZN breaks higher.
* Strongest PUT support at $190.85; crucial floor level for price.
* IV Rank at 49.6%, indicating moderate volatility and premium—consider debit spreads or strategic premium selling.
* CALL ratio at just 4% signals heavily bearish sentiment in options, implying caution on bullish trades.
💡 Trade Recommendations:
* Bullish Play: A solid break and hold above $202 could set up a bullish run targeting the $210 gamma wall. Stops just below $197.
* Bearish Play: If AMZN rejects firmly at $202, puts targeting a move back down towards $190.85 could offer a solid risk-reward.
* Neutral traders: Iron Condors or credit spreads between clear ranges ($190–$210) could be attractive.
🛑 Risk Management: Stay tight on risk management, especially in a tricky range-bound scenario like this.
Trade smart, everyone!
Disclaimer: This analysis is for educational purposes only and does not constitute financial advice. Always do your own research and manage your risk before trading.
Amazon is about to DELIVER! 32% UpsideNASDAQ:AMZN
Great Risk/Reward here!
Confirmation of Retest = 🎯$262
- Right at CupnHandle Retest area
- Volume Shelf Support
- 50WMA
- Wr% Green Support Beam
Not financial advice
AmazonAmazon should definitely reach 151.37 (even if it moves up again, it will start to move down again)

AMZN Trade PlanLooking to buy AMZN at market price, with additional entries at 187 and 179 for better positioning.
🎯 Profit Target: 210 - 215
Stay disciplined, manage risk, and let the trade develop! 📈📊
⚠️ Disclaimer: This is not financial advice. Always do your own research and trade responsibly! 💡

AMAZON Bullish Bias! Buy!
Hello,Traders!
AMAZON made a bullish
Rebound after the retest
Of the horizontal support
Level of 190.78$ so we are
Locally bullish biased and
We will be expecting a
Further bullish move up
Buy!
Comment and subscribe to help us grow!
Check out other forecasts below too!

BTCUSD, GOLD & AMZN Daily Trade SetupsIn this update we review the recent price action in Bitcoin, Gold & Amazon and identify the next high probability trading opportunities and price objectives to target. To review today's video analysis, click here!

AMAZON Stock Chart Fibonacci Analysis 031125Trading Idea
1) Find a FIBO slingshot
2) Check FIBO 61.80% level
3) Entry Point > 190/61.80%
Chart time frame: D
A) 15 min(1W-3M)
B) 1 hr(3M-6M)
C) 4 hr(6M-1year)
D) 1 day(1-3years)
Stock progress: C
A) Keep rising over 61.80% resistance
B) 61.80% resistance
C) 61.80% support
D) Hit the bottom
E) Hit the top
Stocks rise as they rise from support and fall from resistance. Our goal is to find a low support point and enter. It can be referred to as buying at the pullback point. The pullback point can be found with a Fibonacci extension of 61.80%. This is a step to find entry level. 1) Find a triangle (Fibonacci Speed Fan Line) that connects the high (resistance) and low (support) points of the stock in progress, where it is continuously expressed as a Slingshot, 2) and create a Fibonacci extension level for the first rising wave from the start point of slingshot pattern.
When the current price goes over 61.80% level , that can be a good entry point, especially if the SMA 100 and 200 curves are gathered together at 61.80%, it is a very good entry point.
As a great help, tradingview provides these Fibonacci speed fan lines and extension levels with ease. So if you use the Fibonacci fan line, the extension level, and the SMA 100/200 curve well, you can find an entry point for the stock market. At least you have to enter at this low point to avoid trading failure, and if you are skilled at entering this low point, with fibonacci6180 technique, your reading skill to chart will be greatly improved.
If you want to do day trading, please set the time frame to 5 minutes or 15 minutes, and you will see many of the low point of rising stocks.
If want to prefer long term range trading, you can set the time frame to 1 hr or 1 day.

Amazon (AMZN) in a Reversal Zone! Key Levels to Watch!📉 Price Action & Market Structure
AMZN has been in a downtrend, forming lower highs and lower lows within a descending wedge pattern. However, recent price action indicates a reversal zone, suggesting potential relief or a breakout attempt.
📊 Key Levels
* Support: $190 - $185 (Put Support & Demand Zone)
* Resistance: $200 - $212 (Call Wall & Gamma Resistance)
* Breakout Level: $220 (Major Resistance & Positive GEX Zone)
🟢 Bullish Scenario
* A breakout above $200 may push AMZN towards $209-$212, aligning with the highest call wall.
* If momentum sustains, a move toward $220 is possible.
🔴 Bearish Scenario
* Failure to hold $190 could lead to retesting $185 - $180, aligning with the negative GEX zone and put support.
* If broader weakness continues, downside targets extend toward $175 or lower.
📈 Indicators & Momentum
* MACD: Turning bullish, but needs confirmation.
* Stoch RSI: Near overbought, suggesting a pullback or sideways action before continuation.
* GEX Data: Call dominance above $200, strong Put Support at $185, showing market positioning dynamics.
📢 Trade Plan & Summary
* Bullish Above: $200
* Bearish Below: $190
* Scalping/Swing Levels:
* Buy dips near $190, targeting $200+
* Short below $190, targeting $185-$180
⚠️ Disclaimer: This analysis is for educational purposes only. Trade at your own risk.

"E-Commerce Titan on the Rise!!Amazon.com Inc. (AMZN) is exhibiting strong bullish momentum, with a notable gap forming around the $196 level. A breakout above the $216.20 resistance would confirm further strength, positioning the stock to target the $233.00 resistance. This trade setup offers an excellent risk-to-reward ratio, with a stop-loss set at $188.65 to manage downside risk.
Analyst sentiment remains positive, with TD Cowen analyst John Blackledge raising his price target for Amazon to $265, citing factors such as fast delivery speeds driving market-share gains and anticipated growth in Amazon Web Services (AWS) revenue due to enterprise workload migration and generative AI offerings.
Furthermore, Evercore ISI analysts have highlighted Amazon as a top large-cap stock pick for the internet sector heading into 2025, supported by cloud business revenue growth and rising e-commerce margins.
This combination of technical momentum and strong fundamentals supports a bullish push toward $233.00, making AMZN an attractive opportunity for traders and investors alike.
NASDAQ:AMZN

AMZN at a great support levelCurrent price close to 2024 POC (Point of control from Volume profile) and also previous all time high acting as support. If the market breaks down than AMZN being an online retailer, could break the support and a bear market would be confirmed

AMZN FOR BUYAnalyst consensus remains highly favorable for Amazon:
Strong Buy Recommendations: Of 44 analysts, 24 rate the stock as a "Strong Buy," and 19 as "Buy," reflecting strong confidence in Amazon's future performance.
STOCK ANALYSIS
Price Targets: The average 12-month price target is approximately $260.65, suggesting a potential upside of about 34%.
MARKETBEAT.COM
Several factors contribute to this positive outlook:
E-commerce Dominance: Amazon continues to lead in the e-commerce sector, benefiting from its vast logistics network and customer base.
Cloud Computing Growth: Amazon Web Services (AWS) remains a significant revenue driver, with expectations of continued growth due to increasing demand for cloud solutions.
AI Investments: Amazon's substantial investments in artificial intelligence and infrastructure are anticipated to enhance its service offerings and operational efficiency.
BARRONS.COM
However, potential investors should consider certain risks:
Competitive Landscape: Amazon faces competition from other major retailers and cloud service providers, which could impact market share.
INVESTOPEDIA.COM
Profit Margins: Ongoing investments in infrastructure and technology may pressure profit margins in the short term.
INVESTOPEDIA.COM
Market Volatility: As with any stock, Amazon's share price is subject to market fluctuations and broader economic conditions.
In summary, while Amazon's current stock price and analyst projections suggest potential for growth, it's essential to weigh these prospects against the inherent risks and align any investment decisions with your individual financial goals and risk tolerance.

AMZN butterfly & $192.The stock trend of Amazon (AMZN) in 2024 showed significant upward movement, with the price reaching a peak of $230 and a low of $145 during the year, driven by strong market performance and investor confidence.
However, In 2025 based on technical analysis, the formation of a Butterfly harmonic pattern suggests a highly probable correction toward the $190 level .
This pattern, often appearing after an extended bullish trend, indicates a potential reversal. Given the current market dynamics, the likelihood of such a drop is considerable.
Investors should closely monitor key support levels and prepare for possible downside risks while making informed decisions.
SEYED.

AMAZON Is it worth buying now?Amazon (AMZN) broke below its 1W MA50 (blue trend-line) last week for the first time since the week of August 05 2024 and opened this week below it. As you can see, the stock has been trading within a 2-year Channel Up and today's candle is as close to a technical Higher Low (bottom) as it can get.
The previous Higher Low was in fact that Aug 05 2024 candle, which despite breaking below the 1W MA50, managed to post a strong intra-week recovery and close above the it. Technically that was the 'Max pain' situation on every 1W bottom candle in those 2 years.
Every Bullish Leg that followed was around +65.24%, so that gives us an end-of-year technical Target of $300.
-------------------------------------------------------------------------------
** Please LIKE 👍, FOLLOW ✅, SHARE 🙌 and COMMENT ✍ if you enjoy this idea! Also share your ideas and charts in the comments section below! This is best way to keep it relevant, support us, keep the content here free and allow the idea to reach as many people as possible. **
-------------------------------------------------------------------------------
💸💸💸💸💸💸
👇 👇 👇 👇 👇 👇

AMAZON at important support. Positive days coming?AMZN looking at good support. We can see positive days if it works.
Many cryptocurrency dominance charts, as well as Nasdaq and other stock charts too, showing the same pattern. Is the reversal starting? Check my other analysis too.
We’ll see.
This is not investment advice. Please do your own research.
Wishing you best.
-YusufDeli

AMZN up, SPY downAMZN is what NVDA was in 2015. NVDA today is what Amazon was in 2015. Learn the ratios...

What stocks are you looking to trade this week ?NASDAQ:AMZN – Key Zone to Watch! 👀
NASDAQ:AMZN is in a solid zone right now for potential moves.
✅ Strong support level holding steady
✅ Possible upside as the market reacts to news
✅ Ideal for swing traders looking to capitalize
What stocks are you looking to trade this week ?

Amazon (AMZN) Approaching Key Reversal Levels – What's Next?Technical Analysis (TA)
Trend: AMZN has been in a downtrend, forming lower highs and lower lows.
Support & Resistance Levels:
Major Resistance: $202.26 – This is a key level where price could face rejection.
Support Zones: $190 - $195 – A breakdown below this area could lead to further downside.
Indicators:
MACD: Showing signs of bullish divergence, indicating a potential short-term reversal.
Stochastic RSI: Overbought conditions – price could see some consolidation before the next move.
Possible Scenarios:
If AMZN breaks and holds above $202.26, a move toward $209.90 and higher is possible.
If rejection occurs at this level, watch for a pullback to $195 - $190 for a retest.
GEX & Options Flow Analysis
Gamma Exposure (GEX) Highlights:
Highest Positive NetGEX / Call Resistance: $220 – A strong gamma wall, indicating resistance.
Put Support Levels: $190 - $195 – Dealers may have to buy to hedge if price drops here.
Implied Volatility & Options Sentiment:
IV Rank (IVR): 61.1 – Elevated volatility suggests increased uncertainty.
Options Sentiment: Puts = 5.3% – Low put positioning, indicating bullish bias.
Thoughts & Suggestions
A break above $202.26 could lead to a strong upside move, but watch for rejection signs.
If price consolidates above $195, it could signal accumulation before a breakout.
Watch volume and options activity for confirmation before taking trades.
Disclaimer
This analysis is for educational purposes only and does not constitute financial advice. Always do your own research and manage risk accordingly.
