COST Daily Chart Analysis: Key Levels, and Price StructureCostco Wholesale Corporation (COST)
Historical Context and Trend Channel:
From September 2024 through early 2025, COST was observed trading within a well-defined upward channel (indicated by the grey shaded areas). This channel represented a consistent bullish trend during that period. Howeve
Next report date
—
Report period
—
EPS estimate
—
Revenue estimate
—
16,760 CLP
6.75 T CLP
233.23 T CLP
442.62 M
About Costco Wholesale
Sector
Industry
CEO
Roland M. Vachris
Website
Headquarters
Issaquah
Founded
1983
FIGI
BBG00YFSCQY9
Costco Wholesale Corp. engages in the provision of operation of membership warehouses through wholly owned subsidiaries. It operates through the following geographical segments: United States, Canada, and Other International Operations. The company was founded by James D. Sinegal and Jeffrey H. Brotman in 1983 and is headquartered in Issaquah, WA.
Related stocks

Costco, finally.... greenNASDAQ:COST finally seems to be turning around
if it closes above the 21 EMA and 50 SMA on the daily, it can go back to ATHs
will initiate a position at 1000 and stop at 990/980 depending on size
current targets are 1020 & 1035

COST ABC Structure CompletedThe ABC correction may have completed, with the final C leg forming inside a diagonal structure. A sharp drop started from $1,066. Traders should wait for a potential corrective reaction before entering a short position.
It's important to note that as long as the diagonal channel remains intact, th
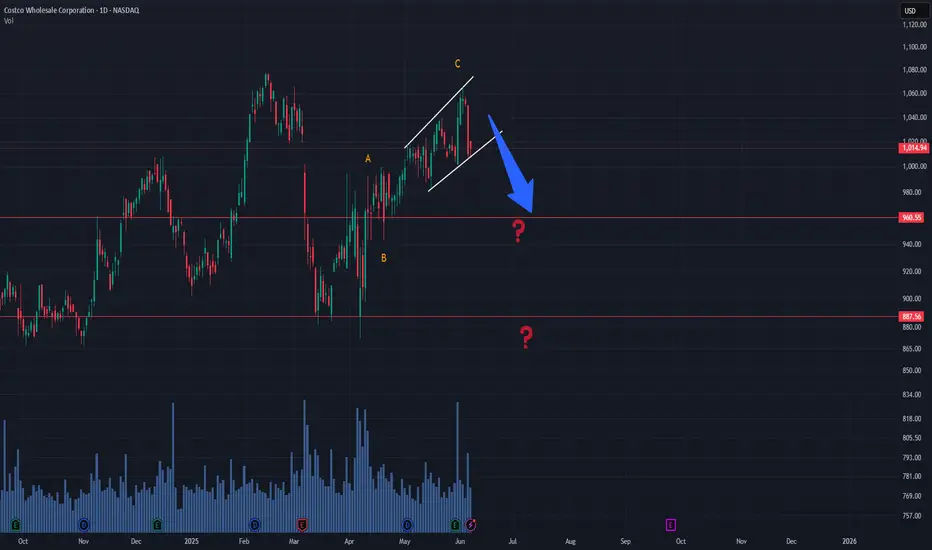
Costco Wave Analysis – 5 June 2025
- Costco reversed from the resistance zone
- Likely to fall to support level 985.00
Costco recently reversed down sharply from the resistance zone located between the key resistance 1080.00 (which stopped the previous impulse wave 5) and the upper weekly Bollinger Band.
The downward reversal from

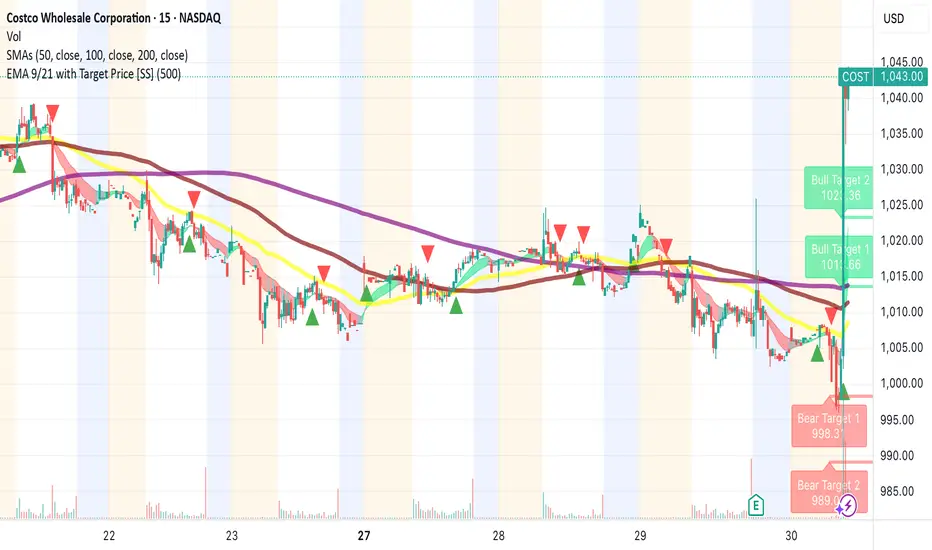
COST Short – Double Top Rejection with Bearish CCI SignalNASDAQ:COST
📅 Entry: June 5, 2025
📉 Price: 1,055
✋ Stop: 1,078
🎯 Target: 1,013
⚖️ Risk-Reward: 1:2
✅ Status: Target hit earlier than expected
🧠 Trade Idea:
COST tested a major resistance zone at 1,078 — aligning with:
A historical horizontal resistance
The top boundary of a rising channel
Meanwhi

Costco (COST) Breakout Alert! Ready to Soar? Costco (COST) Breakout Alert! Ready to Soar?
Hey traders! Check out this bullish setup on Costco Wholesale (COST) . The stock just broke out above key resistance at $987.72 after a solid consolidation phase, with a clear target of $1,052.87 (+4.91% potential gain). The risk-reward ratio here is a

Costco readyNASDAQ:COST looks ready to move up to 1100
closed the gap from last earnings
bullish engulfing candle on the weekly and is breaking out of this 3 week range now
if it raises prices like NYSE:WMT did, might see a boost

“Strategic Closure: ZS and COSTCO Delivered as Expected”Today we closed two well-timed trades: Zscaler (ZS) and Costco (COST).
Both were selected using our 20-point technical and fundamental criteria, with entries planned around earnings and macroeconomic momentum (including today’s GDP release).
✅ ZS gave us a solid return of ~$74, boosted by strong r
"Costco in Focus: Two Catalysts, One Smart Entry"📌 Strategic Entry in Costco (COST): Solid Stock with Immediate Catalysts
Today I entered Costco (COST) by purchasing shares based on our structured methodology of 20 key criteria — combining technical strength, strong fundamentals, and strict risk control. This decision is further supported by two

$COST earnings short, possible uptrend selloff(Sorry for mobile charts/posts)
NASDAQ:COST Hello, looking at multiple time frames on Costco I am going to take a stab at a short. This name isn’t unfamiliar with big moves so an 8% to 10% move could take place here on earnings forecast. Granted, they could not divulge any details but I think tha

See all ideas
Summarizing what the indicators are suggesting.
Neutral
SellBuy
Strong sellStrong buy
Strong sellSellNeutralBuyStrong buy
Neutral
SellBuy
Strong sellStrong buy
Strong sellSellNeutralBuyStrong buy
Neutral
SellBuy
Strong sellStrong buy
Strong sellSellNeutralBuyStrong buy
An aggregate view of professional's ratings.
Neutral
SellBuy
Strong sellStrong buy
Strong sellSellNeutralBuyStrong buy
Neutral
SellBuy
Strong sellStrong buy
Strong sellSellNeutralBuyStrong buy
Neutral
SellBuy
Strong sellStrong buy
Strong sellSellNeutralBuyStrong buy
Displays a symbol's price movements over previous years to identify recurring trends.
COST4977644
Costco Wholesale Corporation 1.75% 20-APR-2032Yield to maturity
4.50%
Maturity date
Apr 20, 2032
COST4977643
Costco Wholesale Corporation 1.6% 20-APR-2030Yield to maturity
4.30%
Maturity date
Apr 20, 2030
COST4977642
Costco Wholesale Corporation 1.375% 20-JUN-2027Yield to maturity
3.87%
Maturity date
Jun 20, 2027
COST4495548
Costco Wholesale Corporation 3.0% 18-MAY-2027Yield to maturity
3.83%
Maturity date
May 18, 2027
See all COSTCL bonds
Curated watchlists where COSTCL is featured.

Frequently Asked Questions
The current price of COSTCL is 899,000 CLP — it has increased by 6.48% in the past 24 hours. Watch COSTCO WHOLESALE CORP stock price performance more closely on the chart.
Depending on the exchange, the stock ticker may vary. For instance, on BCS exchange COSTCO WHOLESALE CORP stocks are traded under the ticker COSTCL.
We've gathered analysts' opinions on COSTCO WHOLESALE CORP future price: according to them, COSTCL price has a max estimate of 1,145,930.78 CLP and a min estimate of 832,553.79 CLP. Watch COSTCL chart and read a more detailed COSTCO WHOLESALE CORP stock forecast: see what analysts think of COSTCO WHOLESALE CORP and suggest that you do with its stocks.
COSTCL reached its all-time high on Feb 18, 2025 with the price of 1,016,600 CLP, and its all-time low was 264,020 CLP and was reached on Feb 8, 2021. View more price dynamics on COSTCL chart.
See other stocks reaching their highest and lowest prices.
See other stocks reaching their highest and lowest prices.
COSTCL stock is 6.09% volatile and has beta coefficient of 0.56. Track COSTCO WHOLESALE CORP stock price on the chart and check out the list of the most volatile stocks — is COSTCO WHOLESALE CORP there?
Today COSTCO WHOLESALE CORP has the market capitalization of 408.69 T, it has decreased by −5.25% over the last week.
Yes, you can track COSTCO WHOLESALE CORP financials in yearly and quarterly reports right on TradingView.
COSTCO WHOLESALE CORP is going to release the next earnings report on Sep 25, 2025. Keep track of upcoming events with our Earnings Calendar.
COSTCL earnings for the last quarter are 4.06 K CLP per share, whereas the estimation was 4.02 K CLP resulting in a 1.01% surprise. The estimated earnings for the next quarter are 5.44 K CLP per share. See more details about COSTCO WHOLESALE CORP earnings.
COSTCO WHOLESALE CORP revenue for the last quarter amounts to 59.97 T CLP, despite the estimated figure of 59.90 T CLP. In the next quarter, revenue is expected to reach 80.30 T CLP.
COSTCL net income for the last quarter is 1.81 T CLP, while the quarter before that showed 1.72 T CLP of net income which accounts for 4.82% change. Track more COSTCO WHOLESALE CORP financial stats to get the full picture.
Yes, COSTCL dividends are paid quarterly. The last dividend per share was 1.24 K CLP. As of today, Dividend Yield (TTM)% is 0.49%. Tracking COSTCO WHOLESALE CORP dividends might help you take more informed decisions.
COSTCO WHOLESALE CORP dividend yield was 0.49% in 2024, and payout ratio reached 26.32%. The year before the numbers were 0.71% and 27.12% correspondingly. See high-dividend stocks and find more opportunities for your portfolio.
As of Jul 1, 2025, the company has 333 K employees. See our rating of the largest employees — is COSTCO WHOLESALE CORP on this list?
EBITDA measures a company's operating performance, its growth signifies an improvement in the efficiency of a company. COSTCO WHOLESALE CORP EBITDA is 11.80 T CLP, and current EBITDA margin is 4.53%. See more stats in COSTCO WHOLESALE CORP financial statements.
Like other stocks, COSTCL shares are traded on stock exchanges, e.g. Nasdaq, Nyse, Euronext, and the easiest way to buy them is through an online stock broker. To do this, you need to open an account and follow a broker's procedures, then start trading. You can trade COSTCO WHOLESALE CORP stock right from TradingView charts — choose your broker and connect to your account.
Investing in stocks requires a comprehensive research: you should carefully study all the available data, e.g. company's financials, related news, and its technical analysis. So COSTCO WHOLESALE CORP technincal analysis shows the strong buy rating today, and its 1 week rating is buy. Since market conditions are prone to changes, it's worth looking a bit further into the future — according to the 1 month rating COSTCO WHOLESALE CORP stock shows the strong buy signal. See more of COSTCO WHOLESALE CORP technicals for a more comprehensive analysis.
If you're still not sure, try looking for inspiration in our curated watchlists.
If you're still not sure, try looking for inspiration in our curated watchlists.