COST Daily Chart Analysis: Key Levels, and Price StructureCostco Wholesale Corporation (COST)
Historical Context and Trend Channel:
From September 2024 through early 2025, COST was observed trading within a well-defined upward channel (indicated by the grey shaded areas). This channel represented a consistent bullish trend during that period. However, the price subsequently broke below the lower boundary of this channel around March 2025, suggesting a shift in the established trend.
Key Price Levels Identified:
Strong Support Level (870 to 880): Marked by the light blue shaded zone, this level has historically acted as a robust floor for the price, demonstrating strong buying interest on multiple occasions.
Good Level (930 to 940): The orange shaded area indicates an intermediate support zone. Should the immediate support fail, this level could come into play as the next area of interest for potential buyers.
1st Support (970 to 980): This green shaded area represents the most immediate support level based on recent price action. The price has recently found support within this range.
Key Resistance (1010): The horizontal red line with circled points highlights a critical overhead resistance level. This level has seen prior rejections, making it a significant hurdle for any sustained upward movement. It also appears to act as a potential "neckline" for current price formations.
Target (1060 to 1070): The red shaded zone at the top represents a significant resistance area and a prior peak. If the "Key Resistance -1010" is overcome, this zone could become the next potential target.
Recent Price Action and Pattern Observations:
Following the break from the long-term uptrend channel, COST rallied to form a peak around the "Target 1060 to 1070" zone in May. The subsequent decline from this peak, followed by a bounce and another attempt at the "Key Resistance -1010" level, suggests the formation of a potential "M" top or double top pattern if 1010 holds. More recently, the price has pulled back to test the "1st Support 970 to 980" zone. The current price action around 988.07 indicates that COST is trading between this immediate support and the "Key Resistance -1010" level. The chart illustrates two potential paths (dotted blue lines):
1. A move upward, challenging and potentially breaking above the "Key Resistance -1010" to target the 1060-1070 zone. This would align with a potential bullish "W" pattern formation if the 1st support holds.
2. A decline to retest the "Good Level 930 to 940" before a potential rebound.
The "Key Resistance -1010" level remains pivotal. A sustained break above it could signal further upside, while rejection from this level could lead to a retest of lower support zones.
Disclaimer:
The information provided in this chart is for educational and informational purposes only and should not be considered as investment advice. Trading and investing involve substantial risk and are not suitable for every investor. You should carefully consider your financial situation and consult with a financial advisor before making any investment decisions. The creator of this chart does not guarantee any specific outcome or profit and is not responsible for any losses incurred as a result of using this information. Past performance is not indicative of future results. Use this information at your own risk. This chart has been created for my own improvement in Trading and Investment Analysis. Please do your own analysis before any investments.
COSTCL trade ideas

Costco, finally.... greenNASDAQ:COST finally seems to be turning around
if it closes above the 21 EMA and 50 SMA on the daily, it can go back to ATHs
will initiate a position at 1000 and stop at 990/980 depending on size
current targets are 1020 & 1035

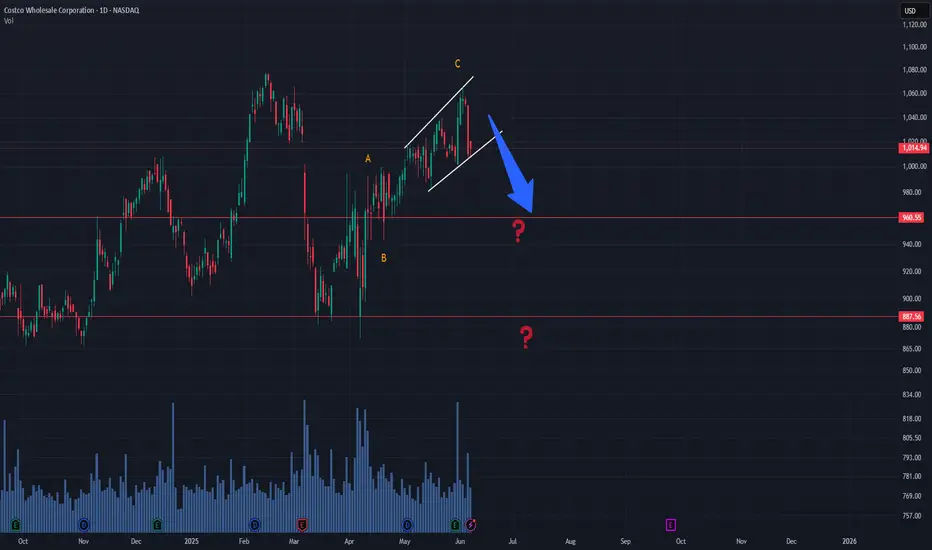
COST ABC Structure CompletedThe ABC correction may have completed, with the final C leg forming inside a diagonal structure. A sharp drop started from $1,066. Traders should wait for a potential corrective reaction before entering a short position.
It's important to note that as long as the diagonal channel remains intact, the zigzag structure can still extend. A clear break below the diagonal would confirm bearish continuation toward the $960 zone.
Costco Wave Analysis – 5 June 2025
- Costco reversed from the resistance zone
- Likely to fall to support level 985.00
Costco recently reversed down sharply from the resistance zone located between the key resistance 1080.00 (which stopped the previous impulse wave 5) and the upper weekly Bollinger Band.
The downward reversal from this resistance zone stopped the earlier weekly impulse wave 5 from April.
Given the strength of the nearby resistance zone and the bearish divergence on the weekly momentum indicator, Costco can be expected to fall to the next support level 985.00.

COST Short – Double Top Rejection with Bearish CCI SignalNASDAQ:COST
📅 Entry: June 5, 2025
📉 Price: 1,055
✋ Stop: 1,078
🎯 Target: 1,013
⚖️ Risk-Reward: 1:2
✅ Status: Target hit earlier than expected
🧠 Trade Idea:
COST tested a major resistance zone at 1,078 — aligning with:
A historical horizontal resistance
The top boundary of a rising channel
Meanwhile, the CCI indicator turned downward, signaling weakening momentum.
A strong bearish daily candle confirmed the entry.
📌 Price dropped quickly to the 1,013 target, completing a clean 1:2 short setup.

Costco (COST) Breakout Alert! Ready to Soar? Costco (COST) Breakout Alert! Ready to Soar?
Hey traders! Check out this bullish setup on Costco Wholesale (COST) . The stock just broke out above key resistance at $987.72 after a solid consolidation phase, with a clear target of $1,052.87 (+4.91% potential gain). The risk-reward ratio here is a juicy 2.47, with a stop at $919.88 to protect against downside.
Why I’m Excited:
Strong momentum with higher highs and higher lows.
Ichimoku Cloud support below, showing bullish trend continuation.
Buy signals (green triangles) aligning perfectly with the breakout.
Trade Plan:
Entry: $1,003.41 (current price)
Target: $1,052.87 (+4.91%)
Stop Loss: $919.88 (-1.99%)
What do you think—bullish or bearish on COST? Drop your thoughts below, like if you’re in on this trade, and share with your trading crew! Let’s get the convo going!
#Costco #Bullish #Breakout #Trading #Investing

Costco readyNASDAQ:COST looks ready to move up to 1100
closed the gap from last earnings
bullish engulfing candle on the weekly and is breaking out of this 3 week range now
if it raises prices like NYSE:WMT did, might see a boost

“Strategic Closure: ZS and COSTCO Delivered as Expected”Today we closed two well-timed trades: Zscaler (ZS) and Costco (COST).
Both were selected using our 20-point technical and fundamental criteria, with entries planned around earnings and macroeconomic momentum (including today’s GDP release).
✅ ZS gave us a solid return of ~$74, boosted by strong revenue growth and an optimistic outlook.
✅ COSTCO, a low-volatility play, added ~$21 to our account thanks to its stable uptrend and reliable fundamentals.
💵 Total gain: ~$95 in under 48 hours.
No leverage, no gambling — just clean execution and strict risk management.
⚠️ This is not financial advice. Just part of my journey as a disciplined trader. I log the wins and the losses. One trade at a time. 🧠📊
"Costco in Focus: Two Catalysts, One Smart Entry"📌 Strategic Entry in Costco (COST): Solid Stock with Immediate Catalysts
Today I entered Costco (COST) by purchasing shares based on our structured methodology of 20 key criteria — combining technical strength, strong fundamentals, and strict risk control. This decision is further supported by two major short-term catalysts.
🔍 Why Costco – and Why Now?
✅ Meets our full 20-point checklist:
Strong uptrend (above MA50 & MA200)
Healthy RSI, not overbought
Consistent volume supporting price action
Fundamental strength: steady growth, recurring revenue via memberships
Clear risk management: no leverage, capital exposure <6%
📈 Catalyst #1: Earnings Today (May 29)
Analysts expect EPS of $4.24 and revenue of $63.1B. Historically, Costco tends to outperform expectations, which may trigger a bullish move.
🌎 Catalyst #2: U.S. GDP Release (Today at 8:30 AM EST)
With forecasts around +2.2%, confirmation would support a strong consumer environment — ideal for retail leaders like Costco.
🧠 Our Execution Plan:
Buying the shares directly (no options, no leverage) to avoid inflated IV risk.
Target zone: $1,040–$1,070 short term.
Trailing stop in place to protect gains post-earnings.
📊 Bottom Line:
This is not speculation — it’s structure. Costco offers a rare alignment of solid fundamentals, technical confirmation, and immediate macro + micro catalysts.
Strategy on. Emotions off.
📌 Disclaimer:
This content is for informational and educational purposes only. It does not constitute financial advice, investment recommendations, or a solicitation to buy or sell any securities. Always do your own research or consult with a licensed financial advisor before making investment decisions.

$COST earnings short, possible uptrend selloff(Sorry for mobile charts/posts)
NASDAQ:COST Hello, looking at multiple time frames on Costco I am going to take a stab at a short. This name isn’t unfamiliar with big moves so an 8% to 10% move could take place here on earnings forecast. Granted, they could not divulge any details but I think that wouldn’t be good and amidst the tariff rhetoric which has been the narrative for retail names could add headwind. 6/6 $900p is what I will take a stab at. 1 contract will suffice as there could be a good R/R especially if you hedge. If you look at the Monthly chart this thing is bought up heavily. I am going to try and get a good entry so I’m not risking what I may feel is too much on an earnings “lotto.” $100-$150 on a contract will be good in my book.
WSL

Costco Wave Analysis – 20 May 2025- Costco broke resistance level 1020.00
- Likely to rise to resistance level 1080.00
Costco recently broke the resistance level 1020.00, which stopped the previous waves 1 and (b), as can be seen from the daily Costco chart below.
The breakout of the resistance level 1020.00 accelerated the active impulse waves 3 and (3).
Given the clear daily uptrend, Costco can be expected to rise to the next resistance level 1080.00 (former monthly high from February and the target price for the completion of the active impulse wave 3).

COST - breakout above $1020 steady uptrendCOST - stock in an steady uptrend but now consolidating and holding support well. Looking for calls on this one above $1020 for a breakout move higher. Next resistance at $1050 and $1075. Stock is strong on indicators. Stock has earnings end of the money could see $1110 pre earnings.
COSTCO: 4 touches/rejections. Can we pop over gap?Costco looks loaded.
4 touches along the resistance, looks like a big wedge forming. Next touch can be a break out to upside, fill gap and move with momentum upside.
OR
Green ray for the entry to downside. We got data tomorrow as well..
Do your DD! Not FA but let me know what you think!

Base Case Costco 810. Total company revenues were up 6% compared to a year ago. The Profit Margin of 2.9% was better than the longer-term average of 2.5%. A 90x multiple applied to a Sales Growth Rate of 9% would imply a share price 810. Costco's narrative revolves around execution. Considering the company continues to execute and deliver top-line growth, the stock will be rewarded in some form.

$COST Rising WedgeCost perfectly tagged the upper line of the rising wedge that we have seen play out over the past couple of weeks. I opened some puts at the top today in hopes that it breaks to the downside of this wedge for a target around $900. This would also complete the right shoulder of H&S on daily chart.

Ascending Wedge - Right ShoulderNASDAQ:COST is currently trading within a well defined ascending wedge that looks like it may be forming a right shoulder on the daily chart. Looking to get short near 1,020.

COST - breaking out gap fill above $1000COST - stock is about to enter the gap to $1026.50. looking for calls above $1000 for a move towards gap fill. Stock is moving strong with momentum but has rejected this area multiple times. key level to watch is 1k. Stock is decent on indicators.

$COST Getting TiiightCostco has been bouncing between these trendlines the past couple of days. I'm expecting a big move in either direction soon, but right now its 50/50. My lean on the longer time frame is to complete the H&S on the daily chart to the downside after potentially trying to fill the gap at 1020.

COST /LONG D1/WCasco is still in an upward trend in the upper half. It is trying to fill the gap. It is above the moving averages. And the moving average 20 is below the rest and one side up. My good friend. I would be happy if you follow me and leave me a comment.


Bear ConfirmationThe stock has broken out of the ending diagonal and successfully retested the lower boundary trendline.

Reversal Pattern Triggered, Key Levels in FocusCostco has formed a clear Head and Shoulders pattern within an ascending channel that supported price action since late 2023. The recent break below the neckline suggests a potential trend reversal and opens the door for a deeper correction.
Price has broken the lower boundary of the channel and is currently trading around $916.48. If bearish momentum continues, key support levels to watch are:
🔹 $876.47 – first reaction zone after the breakdown.
🔹 $788.38 – intermediate support.
🔹 $713.76 – measured move target from the H&S pattern.
The bearish outlook would be invalidated with a sustained recovery above the $1,000 area.
📉 Bearish bias remains as long as price stays below the neckline and inside the descending structure.

COSTCO: Massive rebound on the 1W MA50 can go for +45% profit.Costco has just turned bullish on its 1D technical outlook (RSI = 56.966, MACD = -6.590, ADX = 35.211) as it's on the 3rd straight green week ever since it touched and held the 1W MA50. This rebound, though not an absolute bottom on the 2 year Channel Up, is the new technical bullish wave of the pattern. We've had so far 2 main +45.14% price surges in the past two years. We estimate that to be the 3rd and last up until the end of the year. Go long, TP = 1,270.
See how our prior idea has worked out:
## If you like our free content follow our profile to get more daily ideas. ##
## Comments and likes are greatly appreciated. ##
