ABC BullishEL is 467.50
Gap below price.
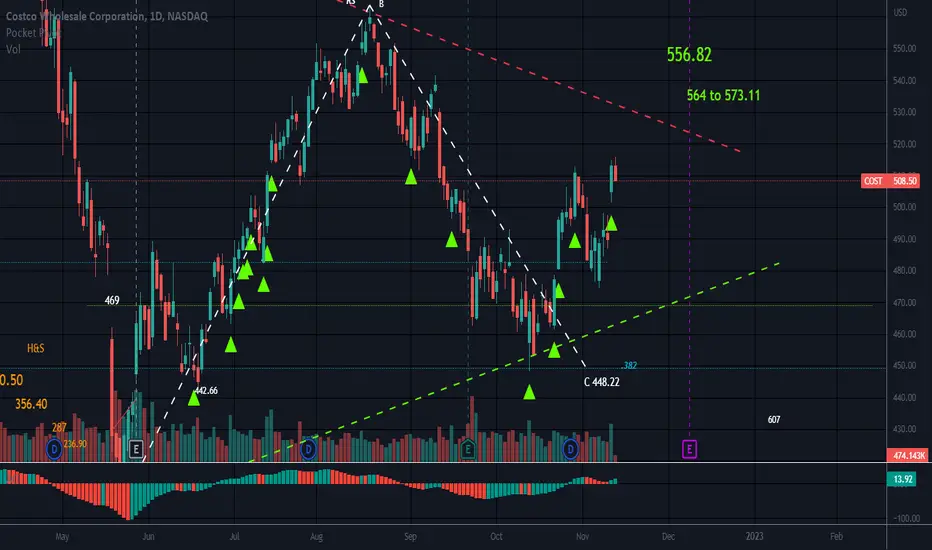
Possible M pattern forming with peak 2 higher than peak 1 but too soon to know. If true the pattern could take this down a notch or 2.
Folks get nervous closer to earnings and long entry level can be crucial.
There is also in a Symmetrical triangle in this chart and the red resistance line will have to be broken to reach all targets.
Prior Head and Shoulders but price is above the neckline of 469 so the neckline is support for now (targets to the left in orange type for this pattern)
Possible stop under C.
No recommendation.
ABC and target is D.
Earnings 12-8 AMC.
Short interest is low at around 1%.
Price opened (top of red candle) at close of yesterdays candle (top of green candle) but so far today the bulls have been unable to keep price at yesterday's close and at this moment, price is drifting downward.
COSTCL trade ideas


COST, Another clean short set up !COST is offering another clean short set up.
After proposing a beautiful and profitable Quasimodo pattern , COST reached to our first proposed take profit target ( See Related idea for details). After hitting our target , COST started a rally which is beautifully an abc form of counter trend correction . This abc form counter trend correction hit 0.618 retracement level of previous decline . Mentioned previous decline which was our short position is beautifully 12345 leg down therefore in terms of Elliott waves, every thing is it's right place to go short.
Moreover, stochastic indicator is in overbought zone in daily time frame which may be a good signal for possible trend reversal.
Please note two cluster of Fibonacci levels can be seen on the chart. COST has reacted well to first cluster which also nicely coincides with down trend line shown on the chart. This down trend line is a valid one since it has 3 rejection in it's history and yesterday hit might be the 4th rejection.
Trade set up and information were also added to the chart. Please note that besides all these bearish evidences , our proposed set up may not go well therefore I kindly ask you to set stop loss carefully . As explained on the chart, if you can tolerate more risk it may be a good idea to set stop loss higher at 565 USD. Our take profit targets show our Reward to Risk Ratio is extremely high so I think it is good to take the risk.
Good luck and wish you continuous profit.

$COST Short Idea - First target 465Market has been rallying but today seemed suspect and pop in VIX implies smart money possibly hedging under the hood.
Time to start looking for hedges / short opportunities , whether we get a large move down or just a pullback before going higher, IMO in the near term we see some selling.
Costco is at trend line resistance and therefore I see it as a good hedge/ short candidate. Also at the top of the BB , implying as a mean reversion trade we at least see 495, with 465 being the max profit taking level for me.
For the less risk adverse can trade a 525/530 call credit spread or a 525/520 put debit spread, although all out short / long put is also an option ... I'm looking at DEC opex.
Cheers - Frisco

Head and Shoulders/Symmetrical TrianglePrice is above the neckline which is strong support.
The triangle is neutral until broken.
Earnings 12/9. Analysts numbers are softer than last quarter.
Short interest is low at around 1%.
No recommendation.
Upcoming Quarter's Earnings
Announce Date
12/9/2022 (Estimated)
EPS Normalized Estimate
$3.14
EPS GAAP Estimate
$3.14
Revenue Estimate
$54.87B
EPS Revisions (Last 90 Days)*
UP-7 Down-6

COST (COSTCO) massively bearish head and shoulders patternCOST (COSTCO) has formed a massive head and shoulders pattern over the past year, which seems like a no-brainer opportunity to get short.
COST could possibly reach 440 by the middle of October and 407 by the first week of November if the price breaches the neckline around 464. A period of consolidation could delay these estimates by several days.
Disclaimer: I am not a financial advisor, and the above statements are not investment advice. My comments are only intended for educational purposes. You are solely responsible for your own trading decisions.

COST bearish 10/20/22COST is currently trending in a rising wedge pattern and it's looking like it's coming to an end soon.
Further analysis and supporting technicals are annotated in the chart.

COST daily bullish hammerOrder BUY COST NASDAQ.NMS Stop 473.44 LMT 473.44 will be automatically canceled at 20230401 01:00:00 EST
COST daily bullish hammer with RSI divergence gotta be quick 1.2R countertrend.

Head and Shoulders Price is below the neckline of 469.
Retests of the neckline are common.
Price is breaking the support line of a symmetrical triangle.
Targets in orange type.
No recommendation.
This pattern is valid when the neckline is broken as it is a strong source of support. The right shoulder or 1st shoulder represents a strong uptrend that pulls back as trends often do. Then the head is formed with another surge of momentum and a new high is reached. Once more the stock pulls back and those who have missed out buy the pull back. The last shoulder can represent FOMO (fear of missing out) but is also a good time to sell your position if you got in during the head formation. The left shoulder should be in the same ballpark price wise as the right shoulder but rarely are they the same exact price.
Bearish engulfing candle today.
No recommendation.
Don't lose your shadow.,

COST: Head and Shoulder Pattern!Classic head and shoulders pattern. Expecting ~20% drop, coinciding with broader economy and stock market "waterfall" downturn.
images.app.goo.gl

COST still bearish for FridayI expect a second large drop on open tomorrow. When we hit support earlier today it sent most stocks into a near parabolic climb.
Rising wedges are forming on a lot of stocks, I think this sets us up for a breakdown tomorrow morning.

Cost looking bearish stillI think we're gonna have some temporary relief here in this rising channel before falling out and either....
1. COST breaks the support and drives down to $446/$448 levels.
or
2. COST bounces at support and goes back up to retest a gap fill.

Market leaders has topped up Some market leaders' stocks showing monster reversal patterns, could this all just a beginning of tsunami

Dec Earnings could be last strawBig diamond top forming-
Either
1. We continue this bullish momentum until we hit top right of diamond (around 533-540 range) beginning of November
1a. From here we go down (495-500ish), bounce and go back up and break out of the diamond
1b. We go down (495-500) consolidate at the end of the diamond and fall at earnings
2. We go down to the bottom of the diamond one last time around $474 then continue on up to the top right diamond trendline (533-540)
2a. From here we go down (495-500ish), bounce and go back up and break out of the diamond
2b. We go down (495-500) consolidate at the end of the diamond and fall at earnings
3. less than stellar October earnings of the overall market drag us down and out of the diamond early causing a nice big crash, but Costco December earnings help put us on new bullish reversal momentum.

Symmetrical TriangleLarge Symmetrical Triangle that is neutral until broken.
Head and Shoulder that has broken the neckline and is now back above the neckline so it is a source of support once again.
No recommendation.
Everything changes except change.

Costco deep retracementCost has been retraced to the lower boundary of the previous ascending channel. would continue to monitor and wait for a price action rejection. we might get this very soon or wait till 2 weeks. price rules the market.
Caveat emptor. This isnt a recommendation. it is for educational purposes only.

Costco slashing prices! COSTAbout to go through pivot level in what otherwise looks like a finished impulse. Picking conservative, fractally evident levels.
We are not in the business of getting every prediction right, no one ever does and that is not the aim of the game. The Fibonacci targets are highlighted in purple with invalidation in red. Confirmation level, where relevant, is a pink dotted, finite line. Fibonacci goals, it is prudent to suggest, are nothing more than mere fractally evident and therefore statistically likely levels that the market will go to. Having said that, the market will always do what it wants and always has a mind of its own. Therefore, none of this is financial advice, so do your own research and rely only on your own analysis. Trading is a true one man sport. Good luck out there and stay safe.

Double H&S with neckline tilted downweekly head and shoulders with sloping neckline at the bottom, in these cases the entry is anticipated on the right shoulder, something confirmed by another newspaper and daily shoulders

COST, Bearish Quasimodo pattern is beautifully forming !COST is showing nicely a very popular price action Quasimodo pattern .
Quasimodo pattern is also called Over-Under pattern. It is simply formed by series of Highs and lows as shown on the chart.
Sell zone (568-571 USD) was shown on the chart for COST. In addition to strong static resistance of pattern we also have 0.786 Retracement level of the last major decline in this zone. Moreover, Pull back to broken up trend line might be completed at mentioned Sell zone.
It is also worth to note, All indicators will be extremely overbought if COST can reach to shown sell zone.
As Quasimodo pattern has been proved to be of high probability success , we certainly keep COST in our short watch list but do not jump into trade blindly. As always we need a reversal trigger at sell zone to open our position . Take profit targets are also shown on the chart by green lines.
The reference of the inserted picture was shown on the chart . You can find many other pics and examples simply by googling " Quasimodo pattern ".
Good luck everybody.

COSTNot a financial Advice!
Price Action to the downside.
Sell off coming in if this setup plays.
Risk what you can afford to lose.

$COST with a Bullish outlook following its earnings #Stocks The PEAD projected a Bullish outlook for $COST after a Negative Under reaction following its earnings release placing the stock in drift D with an expected accuracy of 75%.

Head and ShouldersEarnings we this afternoon and it looks like they beat the numbers.
This pattern is neutral until the neckline (479) is broken with a downtrend.
The neckline is support until broken.
No recommendation
