COSTCL trade ideas

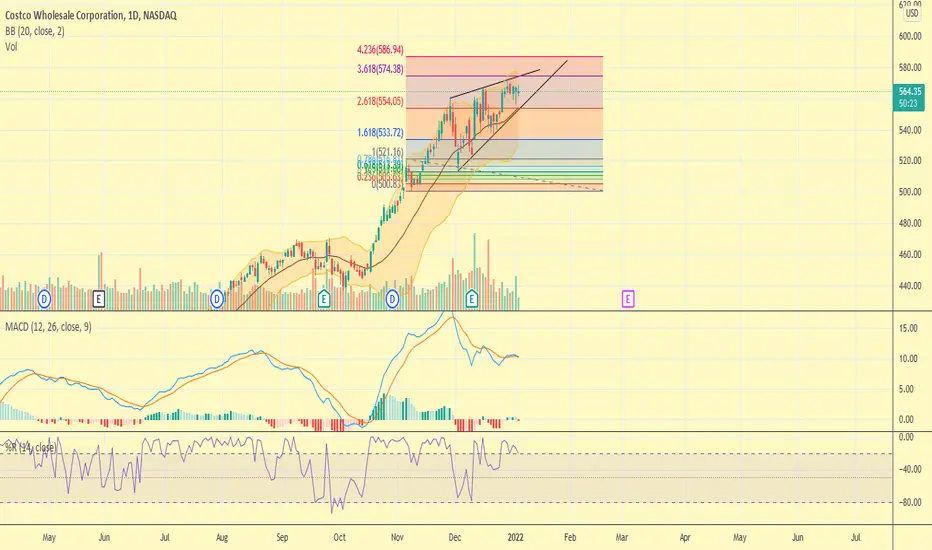
Rising Wedge with Bearish Divergence on the MACDLooks like we may get a pullback from the highs here off the Bearish Divergence on the MACD and the impending overbought condition on the RSI at the top of this Rising Wedge Pattern.

cost toppingseems to be forming a rising wedge with timing aligning it up into that 113 i would ideally like to see it tap that and start to break the bottom trend line to bring it down, Nice divergences setting in as well
not financial advice


COSTNice uptrend since December, 21. Bullishly out of a minor downtrend. I expect it to enter 600s this year.

Short COSTCostco has had a significant run-up that last few months, but is trading like a tech stock at the moment. The stock has had difficulty breaking above the 3.618 fib level and a rising wedge has developed. My first target to the downside is 537. This setup is nullified if COST rises above 575.
Beginner's Charting Attempt 1: COSTFirst: Any constructive criticism is very much appreciated and helpful! :)
So here I am, an absolute beginner with a couple crayons of knowledge: I just drew in what I observed to be wedges. The first a rising bullish wedge that continued to a bullish trend. That wedge was followed by a falling bearish(?) wedge. I thought a continuation pattern (bearish) was more likely than a reversal (bullish) because of resistance (COST had previously hit that high before and didn't break through).
I might've used some of the terminology wrong, honestly. But I'm just trying to journal out my thought process to be able to communicate and work through my own ideas and opinions.

costco sell updatecostco open today and gave profits within the 1st hour.
I expect that position to have been closed in profit.
based on current price action pattern. costco might push up further to create a new high . would continue to look for price action to determine next move.
candle close is vital for next direction.

Potential topping area on Cost decent setup to pull COST down a little on profit taking
Not Financial Advice


Costco sell awaiting Costco opened higher today and sellers stepped in to short it. am awaiting for the 2hr candle to close bearish pin bar.
currently in one sell position. need confirmation to stack.
Costco ~ COSTCostco is a monster .. Looks like it wants 585-590 area where there will be some trendline resistance.
Wouldn't want to even short this thing near the top of the pattern iMO. Can reach 620 if it breaks that 590.
LIS 565 once above.

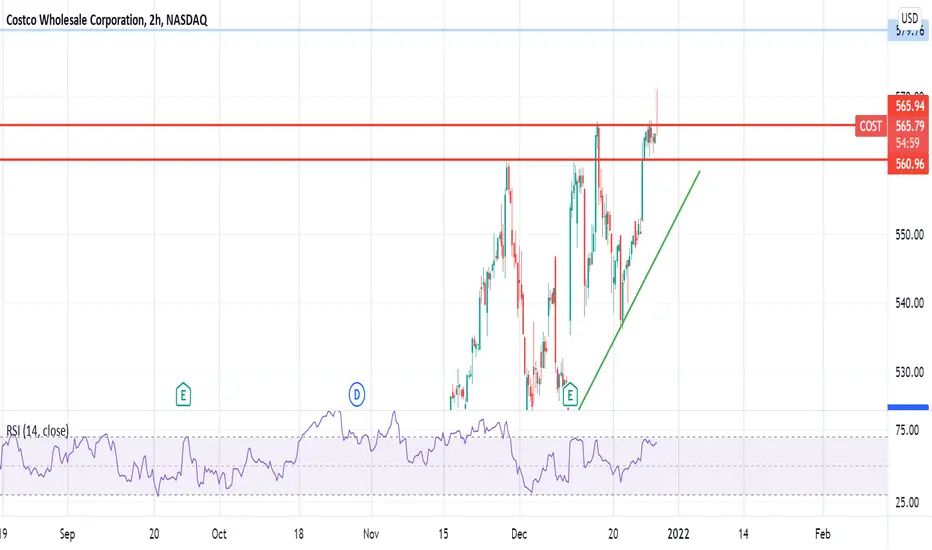
cost sell updatecostco 561 level held well. if price retests this area , only watch what the price action wld do at that point. perhaps we wld see a pin bar print and market rejection.


COST Head and Shoulders forming slowlyCost is forming a bearish pattern and looks like it will be falling soon. SHORTs will be fired

COST: Consolidation.Consolidation is broken upwards with the minimum target level around 408. The long-term resistance level around 386 is also broken upwards. Therefore, the long-term target can be around 465.

Wyckoff Method, $COST (COSTCO)I've notated the area I believe $COST is in with the Wyckoff Method I believe is being used. Will have confirmation soon.

$COST with a Bullish outlook following its earnings #Stocks The PEAD projected a Bullish outlook for $COST after a Positive Under reaction following its earnings release placing the stock in drift A with an expected accuracy of 75%.
If you would like to see the Drift for another stock please message us. Also click on the Like Button if this was useful and follow us or join us.


COSTCO BULLISH ON EARNING REPORTCOSTCO BEAT EARNING EXPECTATION. view turn bullish from reports . a break of previous resistance and expose new highs.

Cost Short when reached 550.98-556.25Cost Put when reach 550-556, Stop loss 567, Target 1 =537.25, Target 2= 528.53

Costco May Witness A Big Jump After Earnings
Costco Wholesale COST is set to give its latest quarterly earnings report on Thursday after the closing bell, Costco will likely report an Earnings Per Share (EPS) of $2.61.
Costco bulls will hope to hear the company to announce they've not only beaten that estimate, but also to provide positive guidance, or forecasted growth, for the next quarter.
Last quarter the company beat EPS by $0.33, which was followed by a 3.31% increase in the share price the next day.
The stock is currently forming a potential continuation pattern (Symmetrical Triangle) to be confirmed by the violation of the $543.00 resistance point. After the pattern being confirmed supported by a probable earnings beant, the price will likely hit the pattern's minimum target around $572.00 point.

costco bearish bias update.Market has not followed thru with a close below 550 . seems the bulls and bears are in a tussle.
