COSTCL trade ideas
It's just startingPrice is poking the upper vertex of the triangle. I think is going to break out soon. I have a long position, If it pulls back I'd buy more.

COST - Rising Trend Channel [MID TERM]🔹COST is in a rising trend channel in the medium long term.
🔹COST has broken a resistance level in the short term and given a positive signal for the short-term trading range.
🔹COST has support at 486 and resistance at 523.
🔹Overall assessed as technically positive for the medium long term.
Chart Pattern;
🔹DT - Double Top | BEARISH | 🔴
🔹DB - Double Bottom | BULLISH | 🟢
🔹HNS - Head & Shoulder | BEARISH | 🔴
🔹REC - Rectangle | 🔵
🔹iHNS - inverse head & Shoulder | BULLISH | 🟢
Verify it first and believe later.
WavePoint ❤️

COSTCO TO 500After EARNINGS, we could see a moving up!
Weekly Fibo lvls are oversold and the indicator Konkorde shows a change in trend
What do u think about it?
Maybe it could go above 500, but I prefer to take profit at that lvls!

COST Costco Wholesale Corporation Options Ahead Of EarningsIf you haven`t sold COST Costco Wholesale Corporation here:
Then Analyzing the options chain of COST Costco prior to the earnings report this week,
I would consider purchasing the 495usd strike price Calls with
an expiration date of 2023-5-26,
for a premium of approximately $9.00
If these options prove to be profitable prior to the earnings release, I would sell at least half of them.
Looking forward to read your opinion about it.

costco rallying to resistance if it breaks massive move coming seems like costco is going to pick a direction soon, if it breaks resistance of the diagonal line a big move coming imo

Costco Wholesale Corporation I 4H TimeframeThis chart only for educational purposes
Here I tired to combine Elliott wave analysis with harmonic and SMC.
My main goal is to look for a strategy I could use in the future using these technical analysis.
It could be wrong specially the harmonic pattern is not confirmed yet and also there is a bullish count based on Elliott, even though we could see some big reactions on the marked areas.
Regards,

COST"It's been a looooong, a long time comin, but I knooooww, a change gon come" comes to mind when looking at this chart. Price has been consolidating in this triangle for a year and recent price action post-earnings feels bullish. Looking for a breakout soon.

$COST: Strategy, Patterns, and ProjectionsNASDAQ:COST is a core position for me. It's a fundamentally strong company:
• The company has a favorable track record of earnings beats, including yesterday's call.
• It has a 15% five-year average return on capital.
• There has been a consistent five-year trend of growth in both revenue and earnings.
• The earnings have been consistently favorable.
• Over the past five years, they have been reducing their debt.
• Their free cash flow is good, but the ratio of FCF to enterprise value is a little lower than I would like. Additionally, the FCF has been somewhat inconsistent over the past five years.
• The five-year average dividend growth is 12%, with 18 consecutive years of dividend increases.
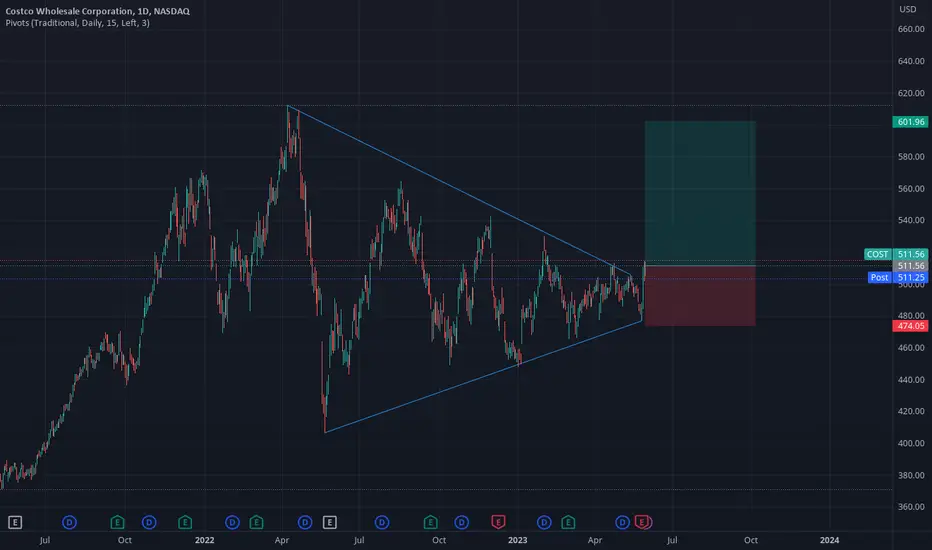
Over the past year, I have been accumulating within this pattern. Although I am not typically a pattern trader, this is a company that I follow closely and the pattern is fairly clear. Triangles are strong trading patterns that reach targets 67% of the time. However, they typically work best with small caps and in rising markets. The price can break in either direction. Projections are placed at the breakout area and are based on the vertical distance between the initial reversal points in the triangle. If the price breaks lower, it could fill the gap in volume between $390-450. $390 is a firm area of support. If it breaks high, a retest of the prior all-time high at $610 is a reasonable target, with the next likely overhead resistance at $650.
I'm unclear whether the movement in late April was a breakout followed by a throwback to the cradle, or whether the symmetry of the movement is still within the pattern. I plan to make an entry now and another entry upon confirmation of a breakout higher. If the move fails and breaks lower, my stop will be at $440 with re-accumulation closer to $400.

COST Earnings COSTCO earning tonight, just noticed it's in a HUGE pennant. Could potentially be a big movement, though the formation isn't complete so maybe it just hits the upper line?
One thing I like about COST is that they have employees checking he entrance and exit, no shrinkage (theft) problems for them.
No position, but I'd be inclined to go long not short. Good luck to the longs. Only issue with the stock is that PE is 35, which is high for a retailer. Growth is gonna slow down which might cause it to break downward out of the pennant eventually, but I don't think it happens tomorrow

six up It operates through the following geographical segments: United States, Canada, and Other International Operations.
its a big company

COST - Top StructureThis Structure that is forming within the channel plotted i am comparing against BTCUSD bear run in 2018.
I believe the structure is a top formation with big downsides ahead.
Bars pattern shows the big drop comparison.

How to Trade Three Inside Down PatternsHow to trade three inside down patterns with entries and stop levels.

COSTCO - BULLISH SCENARIO
Costco Wholesale Corporation (COST) is expected to report strong third-quarter fiscal 2023 results on May 25 after the closing bell.
Several key factors contribute to Costco's positive performance, including its effective growth strategies, efficient price management, steady membership trends, and expanding e-commerce business. By offering products at discounted prices, Costco has successfully attracted customers seeking both value and convenience.
These factors have played a crucial role in the company's consistent sales growth, as evidenced by an estimated 2.4% increase in net sales and a 6.5% rise in total membership fees for the quarter under review. Costco's total paid members continue to grow, driven by its expanding customer base and high renewal rates, which further bolster sales.
The first price target is located at $ 505

Symmetrical TrianglePrice continues to bounce back and forth between trendlines of the triangle.
Slightly below the .236 and above the .382.
No recommendation

COST: bouncing on its 200-dayA price action above 500 supports a bullish trend direction.
Further bullish confirmation for a break above 512.00.
The target price is set at 523.00.
The stop-loss price is set at 493.00.
The price action remains above its 200-day simple moving average. Supporting a bullish trend direction.
Start of upside price momentum also applicable.

COST WCA - Awaiting a Breakout from SymmetryCompany: Costco Wholesale Corporation
Ticker: COST
Exchange: NASDAQ
Sector: Consumer Defensive
Introduction:
Greetings and thank you for taking the time to read my analysis. Today, we delve into the weekly chart of Costco Wholesale Corporation (COST) which has been forming a symmetrical triangle pattern for the past 12.88 months. This pattern is typically a sign of market indecision, and we're anticipating a breakout soon.
Symmetrical Triangle Pattern:
A symmetrical triangle is a chart pattern in technical analysis used by traders to predict future price movements. It is formed when the price of an asset consolidates between converging trendlines that slope towards each other, creating a triangular shape. The pattern is characterized by lower highs and higher lows, indicating a tightening price range as the market reaches a point of equilibrium between buying and selling pressure. In this case, we have 5 clear touch points on the upper trendline and 3 on the lower trendline.
Analysis:
Costco's price is currently above the 200 EMA, and given the clear uptrend preceding the triangle, we are inclined to see this symmetrical triangle as a bullish continuation pattern. However, the inherent indecision signaled by the symmetrical triangle means we should hold off on calculating a price target until a definite breakout occurs.
Moreover, a breakout must occur soon, as the closer we get to the triangle's apex, the weaker the effect of the breakout. This makes COST a high-priority watchlist candidate that should produce a result soon, regardless of the direction it takes.
Conclusion:
The Costco Wholesale Corporation weekly chart analysis points towards a symmetrical triangle pattern, indicating market indecision and a potential breakout soon. Traders should closely monitor this chart for signs of a breakout.
Remember, this analysis is not financial advice. Always conduct your own research when investing and consider risk management and proper position sizing when trading based on chart patterns.
If you found this analysis helpful, please like, share, and follow for more updates. Happy trading!
Best Regards,
Karim Subhieh

COSTCO neutral patternOn the chart we can see a triangle.
The triangle can breakout in either direction, so we can enter when the breakout occurs.
Target for long and target for short are shown on the chart.

$COST 1 Year Wedging PatternNASDAQ:COST Just had an earnings miss... not a bad reaction so far. This has been wedging for about a year now. Also known as a Volatility Contraction Pattern (VCP). I would guess it has to break either way soon. Ideas, not investing / trading advice.


COST coiled enough!!Costco Coiled enough tightly for breakout .Earnings on may 25th. Would love to take some option contracts ending the week following .Defintely worth watching the Breakout of symmetrical triangle.!!! Good luck.

$COST Weekly chart looks ripeHas been holding up long term support well and it just needs to break the trendline to go higher. It might take next earnings to propel it upwards.
