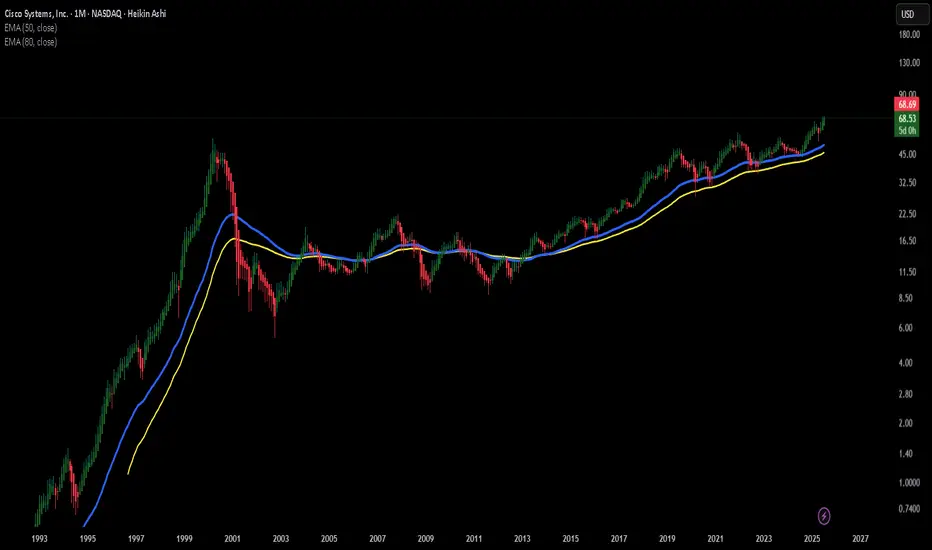
CSCO – Cisco’s Not Done Dancing Yet!
When I look at CSCO, I get the feeling that this old-school tech legend still has some rhythm left in its step. It’s like that uncle at the family wedding who’s been around the block but somehow still manages to pull off a surprisingly smooth move on the dance floor.
It may not be the flashiest stock on the NASDAQ, but there’s something about the way it moves – slow, steady, confident – that makes me think it might just be preparing for another swing to the upside.
From a chart perspective:
Recently, CSCO has been respecting a rising trendline and forming a sequence of higher lows – a classic sign of underlying strength. The price is now approaching a zone that has previously acted as resistance. If momentum builds, this level could turn into a launchpad. Of course, the market doesn’t always follow the script, but the setup looks promising from where I stand.
No predictions, no guarantees – just one trader’s interpretation of the chart. If Cisco keeps moving like this, I’ll be following the rhythm with curiosity (and maybe a fresh cup of coffee).
A lighthearted market musing, not financial advice!
CSCOCL trade ideas
CSCO eyes on $59.22: Key resistance to Tariff Recovery waveThis "internet oldie" usually lags the newcomers.
The key will be to break the Covid fib at $59.22
If we get a dip then look to the sister fib at $57.81

3 Reasons Why Cisco Stock Is Ready to Rocket (Bonus Strategy)3 Reasons Why Cisco Stock Is Ready to Rocket (Bonus Strategy Inside)
Cisco is flashing bullish signs from candlesticks to volume. Here's why a breakout could be imminent — with a bonus momentum strategy revealed.
---
Cisco Systems ( NASDAQ:CSCO ) is showing signs of a potential breakout — and savvy traders should take notice. Here’s why this tech giant is gathering bullish momentum across multiple signals:
1️⃣ Long Lower Shadow Candlestick Pattern
A long lower shadow on the recent candle suggests strong rejection of lower prices. This shows that buyers stepped in
aggressively after an intraday dip — a classic bullish reversal sign that often marks the end of a pullback phase.
2️⃣ Volume Oscillator Below Zero
The volume oscillator dipping below zero may seem bearish at
first, but in context, it shows a decline in selling pressure. When paired with other bullish indicators, this can signal the calm
before a strong move upward — especially if bulls take control on the next candle.
3️⃣ High Volume on the 4H Time Frame
Volume doesn’t lie — and it’s surging on the 4-hour chart. This spike in volume at key support levels adds strong confirmation
that institutional players may be stepping in. When volume rises while price action forms reversal candles, it increases the
probability of a sustained upward move.
---
🚀 Bonus Reason: The Rocket Booster Strategy is in Play
Cisco is also aligning with the Rocket Booster Strategy, which requires:
Price trading above the 50 EMA
Price trading above the 200 EMA
A recent gap up confirmed by Parabolic SAR
Strong supporting volume
This strategy acts like ignition for high-momentum trades — and Cisco looks ready for lift-off.
---
📌 Conclusion:
With technicals aligning and volume building, Cisco could be gearing up for a breakout. Traders should keep an eye on confirmation candles and volume spikes to validate the next leg upward.
---
📉 Disclaimer: Trading involves risk. Always conduct your own research and consult a financial advisor before investing.
---

CSCO Long CallsCisco's uptrend exceeded previous highs and heading toward 127% extension from the 4/9 Tariff lows.
Prices are currently consolidating between $68 and $70 with a volume level.
I am buying in the lower 1/2 - 1/4 of the range with an expectation of a move back to the $70 level and beyond.
August 15 67.5 Calls
E - $68.50
T1 - 69.80
S.L. 30% of option Price

CSCOThe CSCO stock is very promising for investors, with excellent indicators. It has formed a symmetrical triangle on the weekly chart, which has been strongly broken out of after a significant accumulation phase at $55.95. Currently, we are at a resistance zone where we expect a correction. There are two scenarios: either a correction to the upper boundary of the triangle, followed by price action that leads to a strong upward movement towards the target, or a deeper correction to the demand zone that coincides with the 200-day moving average on the daily chart, from which we could see strong momentum pushing the price up to $70.50I hope for the second scenario to occur, as it would provide an excellent entry point close to the stop-loss, which is set at a close below $43.

Cybersecurity Strength Makes It a Stable Long-Term Bet Targets:
- T1 = $68.31
- T2 = $72.05
Stop Levels:
- S1 = $64.34
- S2 = $59.69
**Wisdom of Professional Traders:**
This analysis synthesizes insights from thousands of professional traders and market experts, leveraging collective intelligence to identify high-probability trade setups. The wisdom of crowds principle suggests that aggregated market perspectives from experienced professionals often outperform individual forecasts, reducing cognitive biases and highlighting consensus opportunities in Cisco.
**Key Insights:**
Cisco continues to demonstrate stability in the tech industry, primarily fueled by its strong cybersecurity initiatives. With increasing concerns over digital threats globally, Cisco's dedication to cybersecurity provides a reliable growth channel that sets it apart from many competitors. Additionally, its diversified IT solutions portfolio, ranging from networking to software-defined technologies, underscores its consistency in capturing market share despite macroeconomic headwinds.
However, there is a notable limitation in Cisco's alignment with the rapidly evolving AI sector. While many peers capitalize on AI-focused growth opportunities, Cisco's emphasis remains balanced toward traditional IT and cybersecurity. This could temper some upside potential in comparison to more aggressive AI-focused competitors.
**Recent Performance:**
Cisco has exhibited resilience within the tech sector, having steadily moved higher from its lows in prior quarters. Its price has benefited from the firm's strategic focus on expanding cybersecurity offerings, while its overall revenue progression shows stability despite the sector fluctuations. The stock remains a favorite amongst value-focused investors due to its dividend reliability and relatively low volatility characteristics.
**Expert Analysis:**
Market professionals highlight Cisco's key strength in cybersecurity as a stable, high-growth segment of the broader tech market. This focus aligns well with expanding global demand for robust security solutions across industries. However, analysts caution about possible growth disparity as AI-driven companies take center stage in the next big wave of technological evolution. Despite this, Cisco's broader product suite and well-established market position support its bullish outlook for medium-term appreciation.
**News Impact:**
Cisco's role as a key constituent in high-dividend ETFs like SCHD reflects its reliability and attractiveness to income-focused investors. Additionally, ongoing partnerships and digital security certifications have boosted its market perception in the cybersecurity domain. Investors should keep an eye on potential announcements concerning AI alliances or product expansions, as such developments may serve as catalysts for stronger stock performance.
**Trading Recommendation:**
Based on its steady growth trajectory and emphasis on digital security solutions, Cisco presents a compelling case for sustained upside potential. The stock's current position supports a long trade, with targets reflecting reasonable appreciation within its growth bandwidth. Strategic stop levels align with prudent risk management to mitigate against broader tech volatility. For investors seeking stability in an increasingly uncertain global market, Cisco represents a solid addition to portfolios aiming at moderate long-term returns.

Cisco Is Pushing a Generational HighCisco Systems has climbed as AI investment helps power growth, and some traders may think the move will continue.
The first pattern on today’s chart is the February 13 peak of $66.50. It was the highest level since September 2000, when the dotcom bubble was deflating. The networking giant come within $0.14 of that level on June 9 and remains in close proximity. Is a breakout coming?
(If CSCO were to clear this year’s peak, investors may next eye $82, its previous all-time high from March 2000.)
Next consider the May 15 closing price of $64.26 following strong quarterly results. The stock probed below the level last week and bounced. That may suggest old resistance has become new support.
Third, the 8-day exponential moving average (EMA) has stayed above the 21-day EMA. Such a sequence may reflect a short-term uptrend.
Finally, Bollinger Band Width has dropped as price moves narrow. Could that tightening price action open the door to price expansion?
Check out TradingView's The Leap competition sponsored by TradeStation.
TradeStation has, for decades, advanced the trading industry, providing access to stocks, options and futures. If you're born to trade, we could be for you. See our Overview for more.
Past performance, whether actual or indicated by historical tests of strategies, is no guarantee of future performance or success. There is a possibility that you may sustain a loss equal to or greater than your entire investment regardless of which asset class you trade (equities, options or futures); therefore, you should not invest or risk money that you cannot afford to lose. Online trading is not suitable for all investors. View the document titled Characteristics and Risks of Standardized Options at www.TradeStation.com . Before trading any asset class, customers must read the relevant risk disclosure statements on www.TradeStation.com . System access and trade placement and execution may be delayed or fail due to market volatility and volume, quote delays, system and software errors, Internet traffic, outages and other factors.
Securities and futures trading is offered to self-directed customers by TradeStation Securities, Inc., a broker-dealer registered with the Securities and Exchange Commission and a futures commission merchant licensed with the Commodity Futures Trading Commission). TradeStation Securities is a member of the Financial Industry Regulatory Authority, the National Futures Association, and a number of exchanges.
TradeStation Securities, Inc. and TradeStation Technologies, Inc. are each wholly owned subsidiaries of TradeStation Group, Inc., both operating, and providing products and services, under the TradeStation brand and trademark. When applying for, or purchasing, accounts, subscriptions, products and services, it is important that you know which company you will be dealing with. Visit www.TradeStation.com for further important information explaining what this means.

What Fuels Cisco's Quiet AI Domination?Cisco Systems, a long-standing titan in networking infrastructure, is experiencing a significant resurgence, largely driven by a pragmatic and highly effective approach to artificial intelligence. Unlike many enterprises chasing broad AI initiatives, Cisco focuses on solving "boring" yet critical customer experience problems. This strategy yields tangible benefits, including substantial reductions in support cases and significant time savings for customer success teams, ultimately freeing resources to address more complex challenges and enhance sales processes. This practical application of AI, coupled with a focus on resiliency, simplicity through unified interfaces, and personalized customer journeys, underpins Cisco's strengthening market position.
The company's strategic evolution also involves a nuanced embrace of Agentic AI, viewing it not as a replacement for human intellect but as a powerful augmentation. This shift from AI as a mere "tool" to a "teammate" enables proactive problem detection and resolution, often before customers even recognize an issue. Beyond internal efficiencies, Cisco's growth is further fueled by shrewd strategic investments and acquisitions, such as the integration of Isovalent's eBPF technology. This acquisition has rapidly enhanced Cisco's offerings in cloud-native networking, security, and load balancing, demonstrating its agility and commitment to staying at the forefront of technological innovation.
Cisco's robust financial performance and strategic partnerships, particularly with AI leaders like Nvidia and Microsoft, underscore its market momentum. The company reports impressive growth in product revenues, especially in its Security and Observability segments, signaling a successful transition toward a more predictable, software-driven revenue model. This strong performance, combined with a clear vision for AI-driven customer experience and strategic collaborations, positions Cisco as a formidable force in the evolving technology landscape. The company's disciplined approach offers valuable lessons for any organization seeking to harness the transformative power of AI effectively.

Cisco’s Charts Are Painting a Conflicting PictureCisco Systems NASDAQ:CSCO lost some ground in recent days even as the tech giant kicked off its Cisco Live 2025 event this week in San Diego, and the stock’s charts are flashing some conflicting signals. Let’s take a look.
Cisco’s Fundamental Analysis
CSCO’s three-day Cisco Live event began Monday and has seen some new-product announcements, but the stock has nonetheless struggled -- not surprising given that shares are trading very close to a key technical level.
On one hand, Cisco used the conference to announce a number of innovations, such as a Hybrid Mesh Firewall and Zero-Trust Network Access. The latter is a service that would simplify policy management for clients, as well as enhance visibility and securely scale while not adding complexity to a security stack.
CSCO also unveiled increased integration of the Splunk platform to unify data across all of the firm's services. That should help security teams automate workflows and respond more quickly to perceived threats.
As for earnings, Cisco will report its fiscal Q4 results some time in August.
The firm unveiled fiscal Q3 numbers last month, beating analyst expectations for both top- and bottom-line performance while growing sales 11.4% on a year-over-year basis.
Wall Street seems to think the current quarter will look good as well. Of the 18 analysts I found that cover Cisco, all of them have revised their fiscal-Q4 earnings projections higher over the past few months.
Cisco’s Technical Analysis
While all of that would typically help a stock, different Cisco charts tell very different tales about the stock’s technical picture.
First, here’s CSCO’s chart going back to January:
This chart appears to show that Cisco has developed a “cup-with-handle” pattern stretching from mid-February into June, as denoted with the purple curving line above. That’s historically a bullish pattern.
Cisco then rallied out of the pattern’s “handle” (the short purple diagonal line at right) until shares hit resistance at a $66 pivot point. (CSCO was trading at $64.70 Friday afternoon.)
But pivots are doors that can swing two ways. They can act as a trend accelerant -- kind of like a slingshot -- or they can stop a trend in its tracks. That's why investors keep an eye on them.
Looking at other technical points in the chart above, Cisco is currently riding above both its 200-day Simple Moving Average (or “SMA,” marked with a red line) and its 50-day SMA (denoted with a blue line). That traditionally helps keep portfolio managers invested in a stock.
Cisco is also well above its 21-day Exponential Moving Average (or “EMA,” marked with a green line above). That tends to keep the swing crowd on board.
Meanwhile, Cisco’s Relative Strength Index (the gray line at the chart’s top) looks very strong but is flirting with a technically overbought condition.
And lastly, the stock’s daily Moving Average Convergence Divergence indicator (or “MACD,” marked with gold and block lines and blue bars at the chart’s bottom) looks bullish as well.
The histogram of Cisco’s 9-day EMA (marked with blue bars) is above zero, which tends to be bullish. Similarly, the stock’s 12-day EMA (the black line) is above its 26-day EMA (the gold line), with both in positive territory. That set-up is also typically bullish.
But what if Cisco never takes and holds that upside pivot? Then the stock might have a problem.
Take a look at this chart covering the same time period:
Because Cisco’s pivot is located at roughly the same price level as the left-side apex of the cup-with-handle pattern’s cup, this chart shows a potential bearish pattern brewing for the stock.
Should Cisco stop rising from its current levels of about $64, then the cup-with-handle pattern will suddenly look more like a so-called “double-top” pattern of bearish reversal.
This double-top pattern (marked with “Top 1” and “Top 2” boxes above) would have a downside pivot of $52, the low point between the two tops.
The RSI and MACD in this second chart still lean bullish, but the potentially bearish double-top pattern should be a serious consideration for Cisco investors.
Add it all up and some investors might decide to take a wait-and-see attitude here and watch whether Cisco takes out its $66 upside pivot or not.
(Moomoo Technologies Inc. Markets Commentator Stephen “Sarge” Guilfoyle had no position in CSCO at the time of writing this column.)
This article discusses technical analysis, other approaches, including fundamental analysis, may offer very different views. The examples provided are for illustrative purposes only and are not intended to be reflective of the results you can expect to achieve. Specific security charts used are for illustrative purposes only and are not a recommendation, offer to sell, or a solicitation of an offer to buy any security. Past investment performance does not indicate or guarantee future success. Returns will vary, and all investments carry risks, including loss of principal. This content is also not a research report and is not intended to serve as the basis for any investment decision. The information contained in this article does not purport to be a complete description of the securities, markets, or developments referred to in this material. Moomoo and its affiliates make no representation or warranty as to the article's adequacy, completeness, accuracy or timeliness for any particular purpose of the above content. Furthermore, there is no guarantee that any statements, estimates, price targets, opinions or forecasts provided herein will prove to be correct.
Moomoo is a financial information and trading app offered by Moomoo Technologies Inc. In the U.S., investment products and services on Moomoo are offered by Moomoo Financial Inc., Member FINRA/SIPC.
TradingView is an independent third party not affiliated with Moomoo Financial Inc., Moomoo Technologies Inc., or its affiliates. Moomoo Financial Inc. and its affiliates do not endorse, represent or warrant the completeness and accuracy of the data and information available on the TradingView platform and are not responsible for any services provided by the third-party platform.

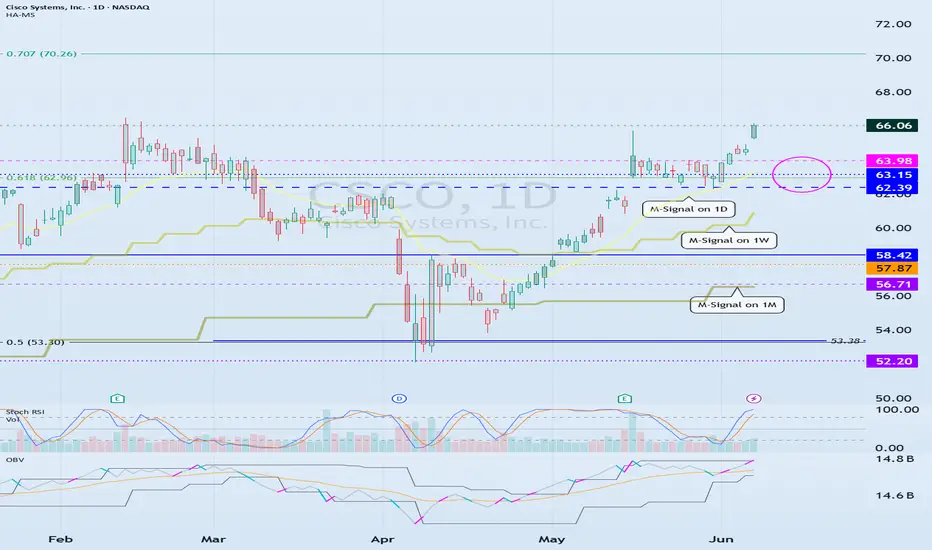
Cisco Wave Analysis – 11 June 2025
- Cisco reversed from the key resistance level 65.60
- Likely to fall to support level 62.20
Cisco recently reversed down from the key resistance level 65.60 (which has been reversing the price from the start of February).
The downward reversal from the resistance level 65.60 created the daily Japanese candlesticks reversal pattern Evening Star.
Cisco can be expected to fall to the next support level 62.20 (a low of the previous minor correction 2 from the end of May).

Need to see if price can hold above 62.39-63.98
Hello traders.
If you "Follow", you can always get the latest information quickly.
Have a nice day today.
-------------------------------------
(CSCO 12M chart)
The most important area on the CSCO chart is around 42.85.
Therefore, if it falls to around 42.85 and shows support, you should check if there is a strong buying trend.
-
(1M chart)
It is showing a stepwise upward trend while rising on the HA-High indicator.
Therefore, the start of the decline is likely to start when it shows resistance on the HA-High indicator.
Therefore, if it falls in the 53.38-58.42 range, it is likely to fall to around 42.85.
If the decline continues, you should check if the HA-Low indicator is newly created.
If it shows support near the HA-Low indicator, it is likely to be a buying period.
-
(1D chart)
There is no way to know how far the price will rise.
However, it is only expected based on the Fibonacci ratio.
Since it has risen above Fibonacci 0.618 (62.96), the next target is expected to be around 1 (94.26).
-
We can find the time to respond by referring to the indicator indicating the high point and modify the detailed trading strategy accordingly.
The indicators indicating the high point include DOM (60), StochRSI 80, and HA-High.
Among them, the indicator used in the basic trading strategy is the HA-High indicator.
The basic trading strategy is to buy near the HA-Low indicator and sell near the HA-High indicator.
However, if it is supported by the HA-High indicator and rises, it is likely to show a stepwise upward trend, and if it is resisted by the HA-Low indicator and falls, it is likely to show a stepwise downward trend.
Therefore, the trading method should be a split trading method.
-
You can predict the trend based on the arrangement of the M-Signal indicators on the 1D, 1W, and 1M charts used in the trend perspective and the price position.
Accordingly, if the price is maintained above the 62.39-63.98 range, there is a high possibility that the upward trend will continue.
If not, there is a possibility that it will fall to the vicinity of 58.42 or the M-Signal indicator on the 1M chart.
If the OBV indicator falls below the High Line or the Low Line, the price is likely to show a downward trend.
Therefore, you should check at what point the support test is performed.
-
It is difficult to grasp the flow in real time for stocks that are renewing the ATH.
However, I think that by using indicators that indicate the high point, you can have some time to respond.
-
Thank you for reading to the end.
I hope you have a successful transaction.
--------------------------------------------------
Tales of Legacy Market LeadersNASDAQ:CSCO , Shifting from legacy hardware to full stack software and infrastructure platform emphasizing high margin and recurring software revenue. Leadership in A.I/Cloud and a RS Rating of 88
I have reasons to believe this equity value can increase

Cisco system looking at a final sub 5-wave impulse structureNASDAQ:CSCO has complete its larger 3-wave structure (ABC) after a strong rebound at 123.6% Fib expansion of wave A-B. In this structure, it shows a possible end to a corrective larger 4th wave and currently, we are on the 5th wave. From breaking out of the falling wedge/flag formation and staying above 62.00, the stock remain strong on the upside.
Momentum indicator suggest strong bullish momentum and as such, we are aiming US$70.16 for the mid-term for CISCO.

$CSCO with a bullish outlook following its earnings #StocksThe PEAD projected a bullish outlook for NASDAQ:CSCO after a positive under reaction following its earnings release placing the stock in drift A with an expected accuracy of 75%.

Rocket Booster + MACD System 20 .Min-DemoOne thing that i am good at is buying bitcoin.
It took me a year to master how to buy Bitcoin,
thanks to a trading competition.
This trading competition was on
Tradingview in 2024, and i ended up being
in the top 10% of traders worldwide
on tradingview.
The profits where calculated using
a simulation trading account.
The competition lasted for about
3 months. This means
you had to build your simulation
trading profit within 3 months.
The highest profitable trader won a prize.
Even though i did not win a prize i had profit
in that competition. This profit was
enough to put me in the top 10% of traders
worldwide, that use the tradigview platform.
It was from this simulation trading
competition that happened
in 2024 thats how i mastered
how to trade Bitcoin.
In this video i show you a system
called "Rocket Booster + MACD Strategy On 3 Time Frames"
In order to use this system effectively
or properly
you will need to subscribe to a
trading view monthly offer
that allows you to use time-frames
for quick and easy
screening of your favourite assets.
In this one we manually dive into.
SO to learn more just watch
this video demo for 20.Min.
Rocket boost this content to learn more.
Disclaimer:Trading is risky please
learn risk management
and profit taking strategies.
Also feel free to use a simulation trading
account before you trade with real money.

OptionsMastery: 2 scenarios on CSCO. 🔉Sound on!🔉
📣Make sure to watch fullscreen!📣
Thank you as always for watching my videos. I hope that you learned something very educational! Please feel free to like, share, and comment on this post. Remember only risk what you are willing to lose. Trading is very risky but it can change your life!

CSCO: Markets Have Memories – Because Traders Do. On Friday, March 7, 2025, after a spectacular 40% rally over the past nine months, CSCO closed at $63.95—just $0.30 below its March 2021 high of $64.25. Every pullback along the way was so brief that if you didn’t have a bid in, you probably missed your chance.
Now, with the stock showing serious strength near multi-year highs, the big question is:
"How far can it go?"
The answer? There’s no limit to how high a stock can go.
Yet for Cisco, the next meaningful stop is $82—a level it last reached 25 years ago.
This stock holds a special place for me. CSCO was the first stock I ever traded when I started as a proprietary trader in 2000. Back then, it was already a "market" stock—plenty of liquidity, relatively low volatility. But in 2000, I struggled to trade it because I thought "it moved too slow."
The irony? I had no idea what "slow" really meant in the markets. Fast forward 25 years, and here’s what I know for sure:
👉 No matter how slow a stock moves, as long as it’s going in your direction, you hold it.
So here I am, 25 years later, finding it hard to believe I’m looking to buy the same stock I first traded a quarter century ago—CSCO.

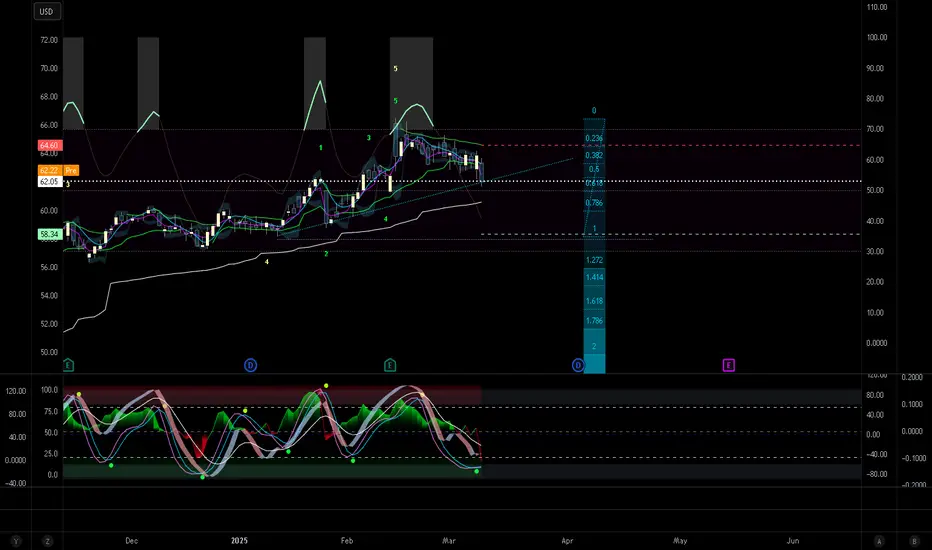
CSCO rally ending soon?My overall thesis is we are in the very early stages of a multi-year decline ultimately with the S&P 500 below 3500. I have been wrong many times before so I will just take this thing in stages and see if it plays out. After this massive decline, we should be in for a great market rally of many decades. I am expecting the market to end its recent rally this week. The current rarely would be about a week in length depending when it began for individual stocks. The rally has done a few important things with its slow and prolonged upward movement, mainly prevents a wave 3 signal from occurring during the next decline.
My wave 3 indicator tends to signal wave 3s and 3 of 3s. See my scripts for the specifics of the indicator. If the market had a short wave 4 up and then a sharp or prolonged drop during wave 5, a new wave 3 signal would occur which violates the currently placed Minor wave 3 (yellow 3). Allowing separation from the current wave 3 signal enables wave 5 to drop quick or slow.
This chart applies select movement extensions based on wave 1's movement on the left and then another based on wave 3's movement on the right. I keep the values between 0%-100% on the chart for wave 2s and 4s retracements of the preceding wave's movement for reference even though the retracement values would be inverted.
Specifically for CSCO, Minor wave 3 was the shortest impulsive wave, likely indicating wave 5 will be 75 bars (30 minute scale) or less. This will likely put a restriction on the length of the decline. Assuming wave 4 ends on Thursday or Friday, Minor wave 5 would be around a week long. In that time, at the very least it should drop below wave 3's bottom of 59.23. Using some basic movement extensions, it will likely go lower. Once we bottom, we should see another rally over a few weeks. I will forecast what that could look like as Intermediate wave 1 nears its end.

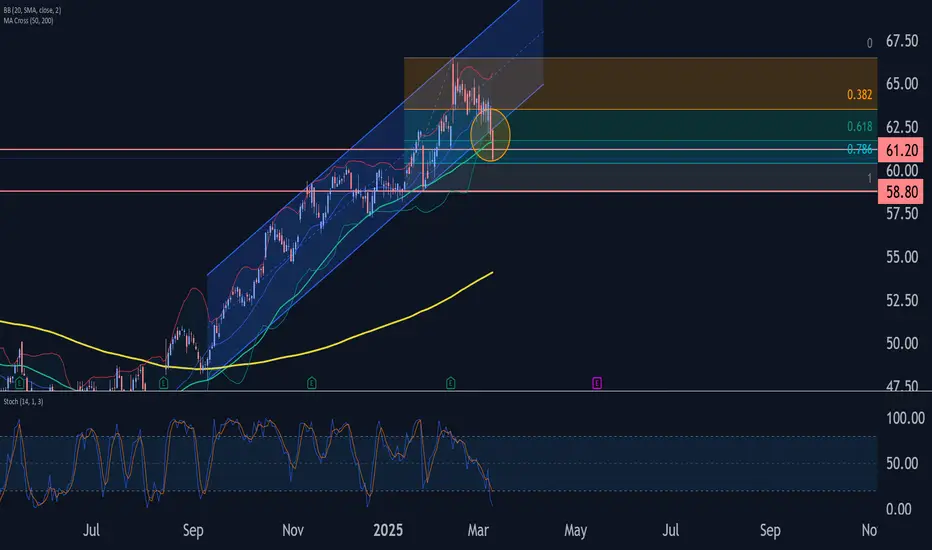
Cisco Wave Analysis – 11 March 2025
- Cisco broke support area
- Likely to fall to support level 58.80
Cisco recently broke the support area between the key support level 61.20 (which stopped the previous minor correction iv in February), support trendline of the daily up channel from September and the 50% Fibonacci correction of the upward impulse from January.
The breakout of this support area accelerated the active impulse wave c of the ABC correction 2 from the start of last month.
Cisco can be expected to fall to the next support level 58.80 (which reversed the price multiple times in January). Support level 58.80 is also the target price for the completion of wave c.
Pivot Confirmed on Cisco. CSCODown we go. Clear tops consolidation pattern post major Elliott impulse to the upside. Fifth Wave impulse in green, now MIDAS break sharp bearish engulfing candle. Lower indicators unreliable from barbwire trading. vWAP indicative of trend reversal.

CSCO: Strong Buy in My Radar List - Feb. 26Technical Analysis (TA) & Price Action
Cisco Systems (CSCO) has recently broken out of a falling wedge pattern and is showing signs of a potential reversal. The stock reclaimed key support levels and is attempting to establish a higher low for continuation.
Key observations:
* Trend Structure: CSCO has broken out of a falling wedge and is attempting a trend shift toward higher highs.
* Support & Resistance:
* Major Resistance: $65.50 (CALL Resistance & Gamma Wall)
* Key Support: $63, followed by $62.50
* Stronger Support Zones: $61 (PUT Wall)
* MACD Indicator: Neutral, awaiting bullish confirmation with a potential crossover.
* Stoch RSI: Cooling off slightly but still in an upward trajectory.
Options Flow & GEX Analysis
The GEX (Gamma Exposure) indicator signals positive gamma flow, with key call resistance aligning near $65.50, suggesting a breakout here could push the stock significantly higher.
* IVR (Implied Volatility Rank): 14.3, with IVx avg at 21.7%, indicating a lower volatility setup.
* Put Side Bias: Only 4% PUT flow, meaning limited downside hedging.
* Key GEX Levels:
* CALL Wall Resistance: $65.50 → Breakout target toward $67.50 (3rd CALL Wall).
* PUT Support Zone: $61 → Breakdown could see a test toward $60.
Trade Plan & Suggestions
📌 Bullish Trade Setup (Preferred Play)
* Entry: Above $64.50 with volume confirmation.
* Target 1: $65.50
* Target 2: $67.50 (3rd CALL Wall)
* Stop-loss: Below $63
📌 Bearish Alternative (Hedge Play)
* Entry: Below $62.50 with increasing selling pressure.
* Target: $61 → $60
* Stop-loss: Above $64
Final Thoughts
CSCO is on watch for a potential breakout above $65.50. Options data shows limited downside risk, while positive gamma exposure could fuel upside momentum. If $64.50 holds, this stock has the potential for a strong bullish continuation.
📢 Risk Management: Adjust stop-loss levels according to your risk tolerance. Be mindful of the upcoming price action confirmation before entering a position.
🔹 Disclaimer: This analysis is for educational purposes only and does not constitute financial advice. Always conduct your own research and manage risk accordingly before trading.

What Network Leap Forward is Cisco Making?Cisco Systems Inc. is not merely adapting to the digital era; it's pioneering it. With strategic foresight, Cisco has leveraged its legacy in networking to embrace the future of artificial intelligence (AI), as evidenced by its optimistic revenue projections for fiscal 2025. This leap forward is not just about increasing numbers but also about reshaping the infrastructure backbone for AI across enterprises, challenging traditional views of network capabilities.
At the heart of Cisco's evolution is the Global Enterprise Modernization Software and Support (GEMSS) agreement with the U.S. Department of Defense, marking a transition from conventional networking solutions to a more dynamic, software-centric approach. This initiative secures Cisco's role in government technology and demonstrates its commitment to modernizing security and efficiency through zero-trust architectures in public sector environments. Such moves inspire us to rethink how security and connectivity can coexist in increasingly complex digital ecosystems.
Moreover, Cisco's strategic acquisition of Splunk and its focus on recurring revenue through cloud services illustrate a broader industry shift towards sustainability and scalability in business models. This pivot challenges business leaders to consider how they can transform their operations to be more resilient and adaptive in an AI-driven market. As Cisco navigates through governmental sales downturns with a diversified supply chain strategy, it sets a precedent for corporate agility in the face of global economic shifts, urging us to look beyond immediate challenges to the vast opportunities on the horizon.
