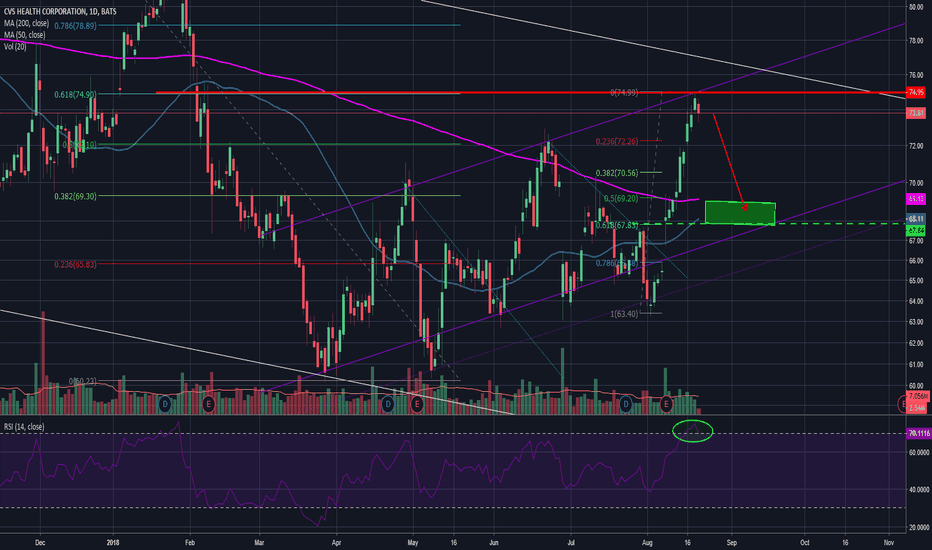
CVS Long Argument.Information regarding my bullish view is provided in the text on the chart.Longby QuileHills2
Long!On this bullish "W" bottom breakout and retest of the breakout level with positive trading!Longby SigmaPicks1
CVS long following bottoming out, monthly bullish divergenceCVS has formed a descending triangle and daily appears to be closing above the upper triangle (break out). We have a monthly bull div on the RSI. A forming daily wedge will provide good stop for our trade. R:R lies in longing at break out confirmation.Longby autemoxUpdated 1
A PRZ - CVSWe may have a PRZ at the 60 level. Price has bounced off of the 60 area (long term 61.8 fib) 5 times over recent weeks and appears to be seeking support here. Target 105 SL below 55 Cheers!Longby hondazzz1
$CVS Long-term Chart Bearish$CVS showing a bearish gravestone doji on the daily to remain trapped in what looks like a descending triangle pattern forming. Ideally would like to see another red candle tomorrow for confirmation. Targeting 5-10% downside in the near term. If $60 support fails, could see 15-20% downside before next ER.Shortby Triple_Barrel_Capital1
This lovely drug store should bounce sooncvs is a dime piece, it has had a rocky road since mid 2015, but this will soon turn around ! Longby adolphus531
Possible double bottom on CVSSeeing a possible double bottom on the daily CVS chart. Possible bounce back upwards? Just an idea not financial advice. Longby bisighini120
CVS offers high risk/reward entryFA wise, CVS is not a terrible stock. The company has been making consistently increasing both in revenues and earnings the last few years. My stock valuation system gives it good scores both in valuation and quality domains. TA wise, the low of $60 at end of March confluently hit the big support trend line and 61.8% fib level and bounced off strongly in 5 waves from there. All of that offers a very promising entry point around $64 level. Latest earnings call which is considered as negative offers us a nice pull back from the last 5-wave bounce taking price right to ~$64 level. Conservative target: $80 (green box). This is also an important POC level in weekly chart. Reasonable target: $90 (blue box). This is a reasonable level for the next considerable retracement. Stop loss: below 60. { "info": { "close ": 64.47, "marketcap ($bil)": 67.1, "name": "cvs health corporation", "sector": "health care", "industry": "medical/nursing services", "country": "united states" }, "val": { "peg_k": 0.40787581, "fp2e_k": 10.12087912, "p2e_k": 10.01086957, "p2e": 9.99534884, "p2bv": 1.7412767, "p2sales": 0.35731722, "p2fcf": null, "ev2ebitda": null, "ev2ebitda_k": null }, "val2_k": 30, "val2_q": 19, "qual2_k": 55, "qual2_q": 38, "qual3_k": 55 }Longby SharpChartsUpdated 0
CVS Relief Rally on the wayShort sellers are exhausted after nearly 5 years of selling. CVS looks to be forming a W bottom at the 60 level, earnings have been steady and increasing for sometime making CVS a great value at this price, expect a 20-40% increase when shorts get squeezed in the coming weeks. My conservative target is in the 83, actual target is 95. Stop is a little under 60. Longby Tanner1
Shorting CVSI think there is more drop ahead. My target range highlighted. Process your way. Shortby goodguy442
#CVS i am long CVS ...price of CVS could double by year endRevenue and Income Net Revenues 2014 2015 2016 2017 139.4B 153.3B 177.5B 184.8B CVS is making money ....business is BOOMING every year , they making more money every year .....this dip is a buying opportunityLongby juliothetrader0
CVS Looking Like a BuyBull wedge, good valuation, skirting the lower bollinger bands both near-term and long-term. Longby isosphereUpdated 2
CVS cycle Buy $60, probably sell at $80 then maybe back to $60 before big rally. Very similar pattern as all other dropsLongby Yogigolf112
Dow drops once again #30 (CVS)Technical Concept: Support broken becomes Resistance (Red Arrows= Resistance) (Blue Arrows= Support) I not use sophisticated Technical jargon in an attempt to persuade and impress the reader because I not a Charlatan I do not use fancy Charts plenty of Indicators, Oscillators, and other stuff, all in a stock chart in an attempt to impress the reader with my knowledge because I not a Tutor or Mentor. I am not either a Business man, Engineer, Doctor, Inventor or Innovator; this requires different skills and personalities Who I am? I am End of Day Analyst and Stock Picker, I support myself in Charts, but I not self-proclaimed Technical Analyst Expert I do not fall into the mistake of comparing and affirm that Technical Analysis is better than Fundamental Analysis . I am a person without Higher Education, and not have Math Skills. I am a right brain oriented person and I focus in my strengths, for this reason I use Charts and I no try to become a Quantitative Trader, since it is a lost cause, in my case. I dedicated 10 lonely years of deliberate practice and in this process, I eliminated all kind of thoughts. I open and reset a lot of Demo Accounts for this purpose I tried and practice with different Markets (Forex, Options and Stocks) with different Time Frames (Intraday, Scalping, Swing/Position). I tried Mechanical Trading too, But definitely I am Discretionary Analyst or Qualitative, It took me years to know it, and a lot of books. I've learned by myself, but I do not think I'm smarter than others, “Ego is a sin” What I do? I pick Stocks manually I watch one by one without the use of a Stock Screener I follow approximately 1300 to 1400 Stocks , with different market cap I have no preference for a particular industry I follow 10 Industries even Public Utilities I do not follow Penny Stocks and Over-The-Counter stocks I not follow Stocks with an Avg_Volume bellow 100,000 with (Low Liquidity) I use a simple method based in Support and Resistance , accompanied with moving averages, and I do a Top down Analysis with multiple time frames My first view of a Stock is a 10 year Weekly Chart, Then I do a zoom in and I focus in the action of the last 2 or 4 Years, I look my Daily Chart and 4-Hrs Chart too I understand the concept of Short Selling and spend hours searching this kind of patterns including the weekends. What I can do for you? I can put ideas in the desk of Professional Traders, the ideas are based in Price Patterns + Price Action, and they can trade with your own system or set up My ideas are not influenced by the media or my neighbors, This was my Resume and Cover letter Sincerely Alex_QuirogaShortby Alex_QuirogaUpdated 8
Valor intrínseco CVSCompañía medica, valor intrínseco calculado a partir de crecimiento en ventas, manejo de deuda, potencial de crecimiento futuro y comparación con otras compañías del sector. Longby Max_PedregalUpdated 4
Gaining MomentumHi guys. I meekly think this is a good potential for a long entry here with CVS; however, I would wait for a small dip. Good luck my friends. Longby UnknownUnicorn2141791227