9/9/2020 - CHEVRON Hi, traders.
My name is Lukas and I am a beginner in trading, respectively, I only trade 9 months. But that means I have to do the necessary analyzes without it I can't trade. I want to show you how I work on myself and document my beginnings. I use Vix and my strategy is built on to return to average. I highlight the important support levels and resistances that flow from the volume profile, all drawn on graph. These zones determine the ability to respond in some way to the market from 1 to 3, with 1 being the largest.
Short description of analysis:
Chevron is below its market average and with the VIX index it creates a great position for the LONG trade. We are in a very volatile period, so I would choose a smaller allocation, so if there were significant declines, the positions would be bought and the average price would change.
Of course, my analysis does not serve like market forecasts and I am not responsible for your trades if you use my analysis for your own trades.
CVX trade ideas

CVXNYSE:CVX
Entered a swing trade today on CVX. Noticed that it landed on a resistance line in the wedge pattern. The RSI has been neutral on all time frames but regardless I view the stock as being undervalued. Fortunately the storms haven't affected production either unlike with XOM.
-Entered early in the morning when it did a fake breakout to the bottom. Entered at $84.06 and closed for the day at $84.91 above the 50 day SMA on the 15 minute and above VWAP so I am anticipating that the stock will gap up tomorrow. Extended trading hours activity looks reassuring of continued uptrend.

CVX has 2 signals! I'm in. $95.44 is the top oneBased on our proprietary alert system, we've spotted some signals on CVX. $95.44 is our top one! I'm in with options and ready to go. will scoop up more on dips
NYSE:CVX


CVX looking for retest of lowsPretty standard to see a retest of the lows, looks like it will be happening in the next few month.

CVX
Shows a strong buy signal ( RSI< 20) when SD of 1.5 is broken.
MACD is showing a strong change in direction
If CVX can stay above 86 range, it could continue rally

Chevron Corp (CVX - SPX) - Bears continue dominationChevron Corp (CVX - SPX) is in ABC zigzag down in 2 hr time frame, where C down is in progress and 4th of C on the way. So stay short for 5th wave down. Here A was leading diagonal so the losses will possibly extend. Keep eye on it, because it is possible that the 1st extended wave of C is just about to end after 5th wave ended.

Chevron (CVX) Stock AnalysisSideways trend - the best option is to hold.
Prices might go upward or downward.
Chevron (CVX) – Chevron reported a quarterly loss of $1.59 per share, wider than the 92 cents per share that analysts were expecting. Revenue also came in below forecasts, amid lower oil and gas prices and the pandemic-related drop in fuel demand.

Chevron DivergenceHey everyone,
keep your eyes open for that divergence in the RSI. My histogram shows a sell sign as well. I think a short position could be usefull :)
What do you think?


Buying Chevron CallsStochastics Up
Trading on low bollinger bands
vwm bearish momentum slowing
clear support at $80
Buying calls between $80 - $85


Chevron Corp (CVX - NYSE) - ABC wave pattern Chevron Corp (CVX - NYSE) has completed WXY in double zigzag pattern from bottom as indicated in chart. It dropped in impulse as wave A and correcting up in wave B, which might take 2-3 days to complete. Thereafter C wave will resume the fall in price action. CVX and XOM are about 22 - 22 % holding value of XLE etf, which drag it down as both has C wave down within 2-4 trading sessions. XOM & CVX have same pattern for C down sell after wave B over.

Growth Cap?Due to electrification and more renewable energy companies. 1/2 of the gas/ oil companies I own and I won't be buying anymore but I would hold these for dividends and possibly sell at 120-130 then pick up again lower.

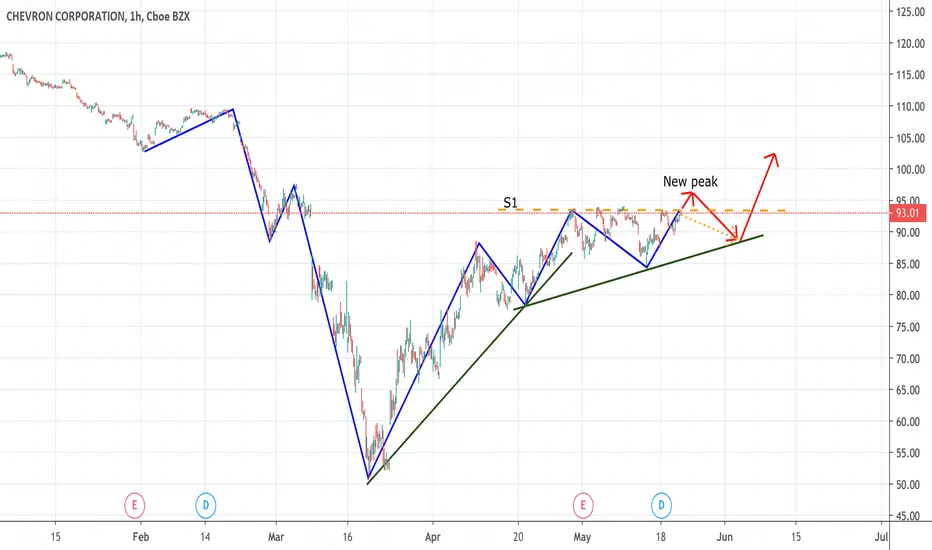
Chevron Corporation (CVX) long.All description on the chart.
Please, don't forget to like and follow.
Thank you.

CVX - Chevron Corporation Technical AnalysisNYSE:CVX
Wait the right time to get in this market with a long position.
Short on CVX A potential short idea for CVX down to around 86.4 after first higher low is confirmed.


Chevron looking like a solid long-term buy. People are scared of oil stocks.
This is the "first sell-off' of a major market cycle.
The opportunity in these oil companies is MASSIVE and the risk is very low.
Buying some of this on my stock account.
Stay profitable!

God Bless The Oil Industry. (CVX)50 year parallel channel shattered. It took 50 years to get there, how many will it take to come down?
Be patient. Give it some time to breathe.

Bearish CVX Analysis
This look like a nice bearish setup. Price broke structure, then rallied to test the previous low. Price did not make any higher lows, it meet resistance at the 50.0 fib level. A double top was created which is a bearish candlestick formation pattern. The previous daly candle look to have formed a bearish candlestick.
