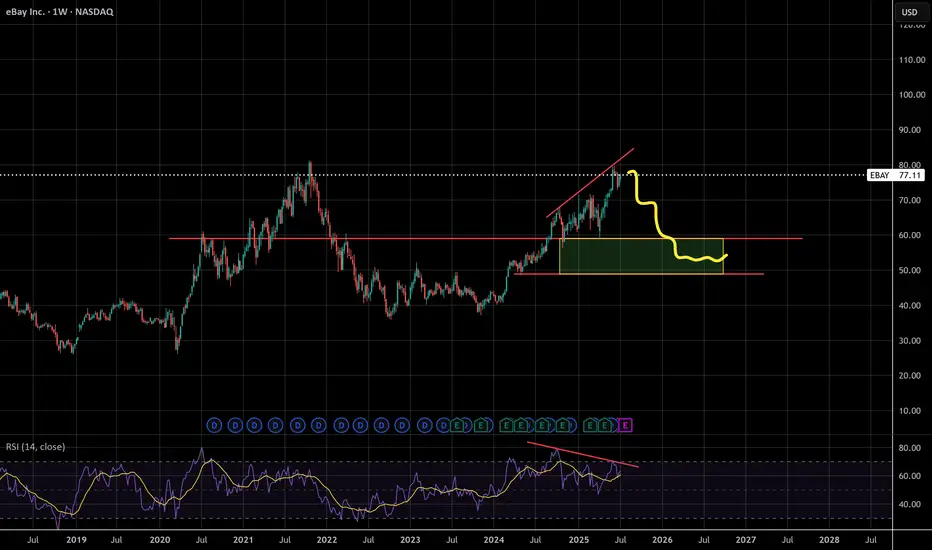
Ebay RSI flashing warnings - Handle forming?Looks like it may be forming a cup and handle, bearish divergence on the RSI
EBAYCL trade ideas
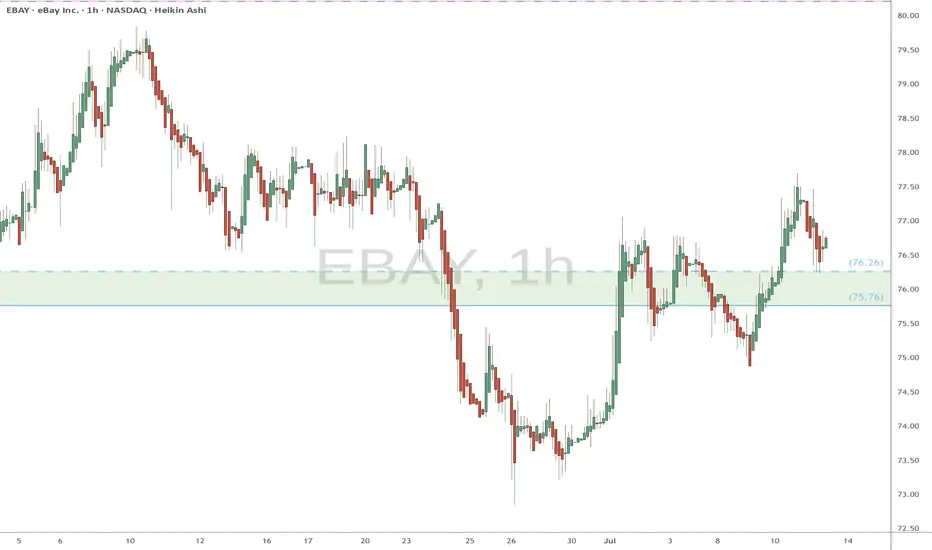
EBAY watch $75.76-76.26: Key Support zone to launch next Leg UP EBAY trying to get back above its ATH from 2021.
Now testing a key support zone at $75.76-76.26.
Good but late long entry with StopLoss just below.
.
See "Related Pubications" for previous charts such as THE BOTTOM call:
Hit the BOOST and FOLLOW for more PRECISE and TIMELY charts.
=========================================================
Ebay Wave Analysis – 24 June 2025
- Ebay reversed from long-term resistance level 80.00
- Likely to fall to support level 71.15
Ebay recently reversed down from the resistance area between the major long-term resistance level 80.00 (which started the weekly downtrend in 2021) and the upper weekly Bollinger Band.
The downward reversal from this resistance area created the weekly Japanese candlesticks reversal pattern Shooting Star.
Given the strength of the resistance level 80.00 and the overbought weekly Stochastic, Ebay can be expected to fall to the next support level 71.15 (former resistance from the start of 2025).

EBAY on WatchWatching the pullback here.
Looking for an entry, but not going to try and catch a falling knife.
Why:
Strong uptrend
20EMA is aligning with .5 retracement
Could be low risk high reward depending on entry

ebay is on sale 🛒Hello TradingView Family / Fellow Traders. This is Richard, also known as theSignalyst.
📈 EBAY has exhibited an overall bullish trend , trading above the orange and blue trendlines.
At present, EBAY is undergoing a correction phase and it is currently approaching a strong support zone 30 - 34
🏹 Thus, the highlighted red circle is a strong area to look for buy setups as it is the intersection of the green support and lower blue and orange trendlines acting as a non-horizontal support.
📚 As per my trading style:
As #EBAY approaches the lower red circle zone, I will be looking for bullish reversal setups (like a double bottom pattern, trendline break , and so on...)
📚 Always follow your trading plan regarding entry, risk management, and trade management.
Good luck!
All Strategies Are Good; If Managed Properly!
~Rich

EBAY heads up into $76: Major Resistance zone could mark a TOP EBAY has been relentlessly grinding away Northward.
About to test a serious resistance zone $75.76-76.26
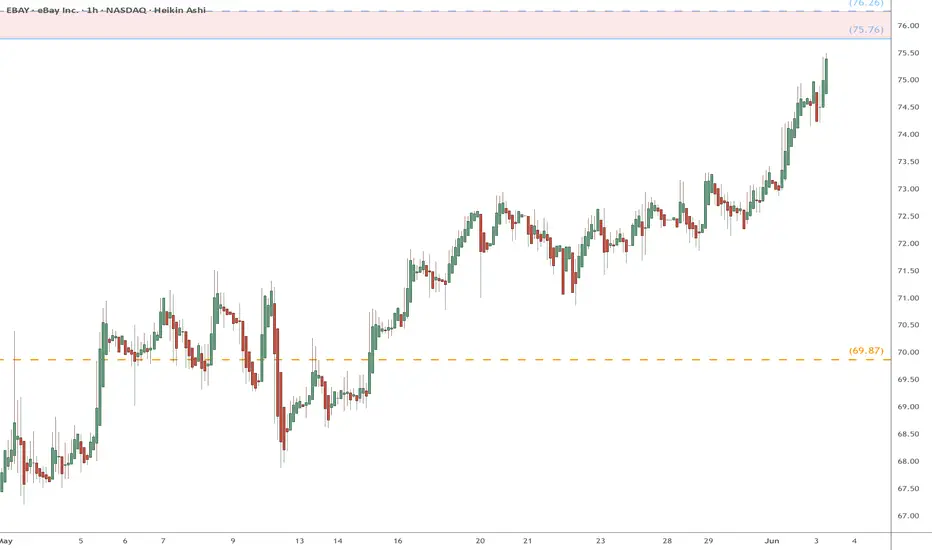
Expecting a dip to possibly the Golden Covid at $69.87
.
Previous Analysis that caught a HUGE breakout:
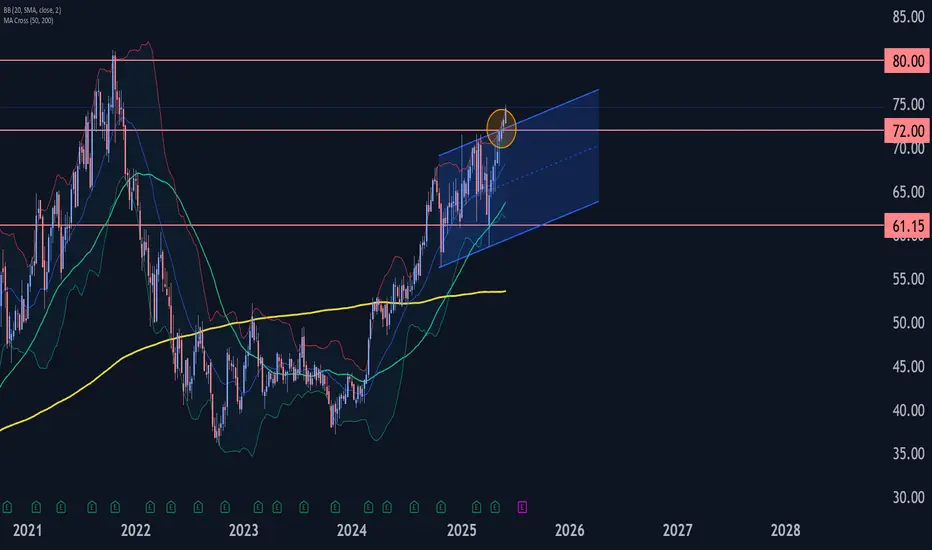
Ebay Wave Analysis – 2 June 2025
- Ebay broke resistance zone
- Likely to rise to resistance level 80.00
Ebay recently broke the resistance zone between the key resistance level 72.00 and the resistance trendline of the daily Up Channel from last year.
The breakout of this resistance zone accelerated the active weekly impulse wave 3, which belongs to the intermediate impulse wave (3) from 2024.
Given the multiyear uptrend, Ebay can be expected to rise to the next resistance level 80.00 (which stopped the weekly uptrend in 2021).
eBay May Be Breaking OuteBay has quietly snuck to multiyear highs, and some traders may look for further upside.
The first pattern on today’s chart is the February 26 peak of $71.61. At the time, it was the highest level since November 2021. However, EBAY broke it on Friday and continued upward on Monday. That could suggest it’s breaking out.
Second is the April 1 high just below $69. The e-commerce stock struggled to get above it in early May but soon turned the old resistance into new support. That’s potentially consistent with an uptrend.
Next, the 50-day simple moving average (SMA) is above the 100-day SMA. Both are above the 200-day SMA. That sequence, with faster SMAs above slower ones, may reflect a long-term uptrend.
Short-term signals may be similarly positive. For example, the 8-day exponential moving average (EMA) is above the 21-day EMA and MACD is rising.
Check out TradingView's The Leap competition sponsored by TradeStation.
TradeStation has, for decades, advanced the trading industry, providing access to stocks, options and futures. If you're born to trade, we could be for you. See our Overview for more.
Past performance, whether actual or indicated by historical tests of strategies, is no guarantee of future performance or success. There is a possibility that you may sustain a loss equal to or greater than your entire investment regardless of which asset class you trade (equities, options or futures); therefore, you should not invest or risk money that you cannot afford to lose. Online trading is not suitable for all investors. View the document titled Characteristics and Risks of Standardized Options at www.TradeStation.com . Before trading any asset class, customers must read the relevant risk disclosure statements on www.TradeStation.com . System access and trade placement and execution may be delayed or fail due to market volatility and volume, quote delays, system and software errors, Internet traffic, outages and other factors.
Securities and futures trading is offered to self-directed customers by TradeStation Securities, Inc., a broker-dealer registered with the Securities and Exchange Commission and a futures commission merchant licensed with the Commodity Futures Trading Commission). TradeStation Securities is a member of the Financial Industry Regulatory Authority, the National Futures Association, and a number of exchanges.
TradeStation Securities, Inc. and TradeStation Technologies, Inc. are each wholly owned subsidiaries of TradeStation Group, Inc., both operating, and providing products and services, under the TradeStation brand and trademark. When applying for, or purchasing, accounts, subscriptions, products and services, it is important that you know which company you will be dealing with. Visit www.TradeStation.com for further important information explaining what this means.

eBay: Resistance Touched!EBAY has managed to fight its way upward as expected, reaching the resistance at $71.51. In the course of the ongoing (corrective) upward movement, the price has now touched this mark for the third time – and once again showed a pullback reaction. Primarily, the stock should rise above the $71.51 level in the next step to complete the beige wave b above it. However, there remains a 27% chance for a new interim low of the magenta wave alt.(X). In this case, the stock would take a detour below the support at $55.96 but would turn upward again above the lower $49.63 mark.

$EBAY $80 EOYA non factor amongst tariff rhetoric. I think the idea of US consumers (even internationally) buying and reselling has never been higher. I think a lot of consumers will start to look for used goods more than ever. I'm eyeing $70 calls for earnings this upcoming week (first week of May 2025) and if it has any pull back I will load the boat for $80 call leaps. I like the structure it's held at this $55-$65 range. I expect new highs on this name maybe earnings can give it a jolt. All the lines you see are 20, 50, 200 SMA and EMA. I could be wrong on earnings as this name tends to dip from earnings even posting beats but that's the gamble of earnings but LONG TERM this name is a good buy. Charts are Monthly and Daily.
WSL.

What Is The #1 Candlestick Pattern?When I decide to help the Trading community I think about which market news gets the most "organic" likes I noticed it was the Dow Jones industrial Average (US30).
Because of this i decided to help you trade them now my expertise is in buying Bitcoin,Gold & Silver.
So learning to trade stock options was going to be a challenge.
I decided to learn 3 things:
#1-So I started by learning about the "3 Step-Rocket Booster Strategy"
#2 -Then I learned about the Candlestick Patterns
#3 -Then I learned about how to use oscillators
--
What Is The Rocket Booster Strategy?
--
This is a strategy used in trend analysis it has 3 Steps
--
1)The price has to be above the 50 EMA
2)The price has to be above the 200 EMA
3)The price has to Gap up
Remember the last step is very important because that step is what you need in order to execute the best candlestick pattern
-
What Is The #1 Candlestick Pattern?
-
They are alot of candlestick patterns and you have to choose your favorite in this case I chose to use the "long lower shadow"
If you want to learn more about candlestick patterns read Steve Nissan's Book about Japanese Candlestick Patterns
-
What is The Best Oscillator ?
-
Now the most common one is called MACD.
But I prefer to use Bull Power
Because this is the oscillator I first used when I was learning about forex trading and lost when I didn't understand how to use it.
Now thanks to the new TradingView Screener I have been able to use in stock options trading.
I will try to make a video tomorrow demonstrating how to trade stock options on US 30 Dow Jones Industrial Average
As today I was so exhausted from a very long walk and day from yesterday.
Stay tuned for a video demo tomorrow
Rocket boost this content to learn more
Disclaimer ⚠️ Trading is risky please learn risk management and profit taking strategies and feel free to use a simulation trading account before you use real money.
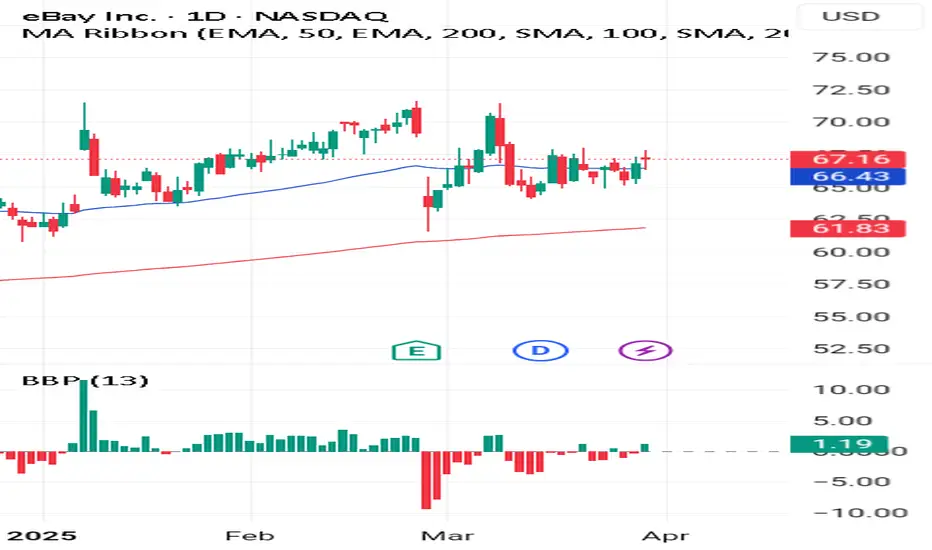
EBAY watch $66.xx: Golden Genesis + Covid fibs for supportEBAY in a wild oscillation after last earnings report.
Currently orbiting/stabilizing around a Dual fib zone.
Look for a clean bounce ("Ping") off this zone for longs.
$ 65.91 - 66.16 is the exact zone of interest.
Top of zone is a Golden Genesis, ideal bounce.
===============================================
.

eBay: (Corrective) Upside AheadAfter a month marked by elevated volatility, EBAY has recently stabilized. We anticipate a continued rise above the $71.51 resistance, where the beige wave b should ultimately form its high. Afterward, the matching beige wave c should take over, triggering declines toward the support at $49.63. However, if the stock fails once again at the $71.51 resistance and then drops directly below the upper support at $61.55, the magenta wave alt.(4) will carve out a new low near the $49.63 level. Thus, this 40% likely alternative scenario would delay the completion of beige wave b.

eBay Might Be in a Diagonal C WaveThe A and B waves in eBay’s structure are clearly identifiable. In the expected C wave zone, overlapping sub-waves and a formation are emerging. If the wave count is accurate, the 5th wave of the diagonal could start moving upward in the marked area.

Ebay Wave Analysis – 10 March 2025
- Ebay reversed from the resistance area
- Likely to fall to support level 66.00
Ebay recently reversed down from the resistance area between the key resistance level 71.15 (which has been reversing the price from January) and the upper daily Bollinger Band.
The downward reversal from this resistance area stopped the previous impulse wave 3 of the higher order impulse wave (C) from November.
Given the strength of the resistance level 71.15 and the bearish divergence on the daily Stochastic, Ebay can be expected to fall to the next support level 66.00.

Ebay Wave Analysis – 4 March 2025
- Ebay reversed from pivotal support level 61.15
- Likely to rise to resistance level 67.00
Ebay reversed up exactly from the pivotal support level 61.15 (which has been reversing the price from last December), standing near the lower daily Bollinger Band and the 61.85 Fibonacci correction of the upward impulse from October.
The upward reversal from this support zone created the daily Japanese candlesticks reversal pattern Long-Legged Doji – which stopped the previous ABC correction 2.
Given the clear daily uptrend, Ebay can be expected to rise in the active impulse wave 3 to the next resistance level 67.00.

Ebay Wave Analysis – 26 February 2025
- Ebay reversed from the resistance level 71.15
- Likely to fall support level 69.00
Ebay recently reversed down from the resistance level 71.15 (which stopped the previous sharp impulse wave 1 at the start of February) standing close to the upper daily Bollinger Band.
The downward reversal from the resistance level 71.15 stopped the earlier impulse waves iii, 3 and (C).
Given the strength of the resistance level 71.15 and the overbought daily Stochastic, Ebay will likely fall further to the next support level 69.00.

EBAY: Strong Buy in My Radar List - Feb. 26Technical Analysis (TA) & Price Action
eBay (EBAY) is trading within a strong ascending channel, approaching key resistance near $71.40. The stock has consistently printed higher highs and higher lows, maintaining its bullish structure.
Key observations:
* Trend Structure: EBAY is in a well-defined uptrend, respecting the channel’s support.
* Support & Resistance:
* Major Resistance: $72.50 (CALL Wall) → Breakout level.
* Key Support: $70, followed by $69 (Gamma Wall).
* Stronger Support Zones: $67.52 (Critical PUT Support).
* MACD Indicator: Bullish, signaling continued strength.
* Stoch RSI: Extremely overbought (97.74), suggesting a potential short-term pullback before continuation.
Options Flow & GEX Analysis
The GEX (Gamma Exposure) indicator signals high positive gamma above $70, which could fuel a breakout if sustained. However, downside risk is limited as PUT support is concentrated near $65.
* IVR (Implied Volatility Rank): 80.1, with IVx avg at 49.2%, indicating heightened volatility.
* Call Side Bias: 10.9% of total options flow, suggesting a moderate bullish tilt.
* Key GEX Levels:
* CALL Resistance / Gamma Wall: $72.50 → Break and hold could send EBAY toward $75.
* PUT Support Zone: $65 → Breaking below would invalidate the bullish trend.
Trade Plan & Suggestions
📌 Bullish Trade Setup (Preferred Play)
* Entry: Above $70.50 with volume confirmation.
* Target 1: $72.50
* Target 2: $75 (Major resistance).
* Stop-loss: Below $69
📌 Bearish Alternative (Hedge Play)
* Entry: Below $69 with selling pressure.
* Target: $67.50 → $65
* Stop-loss: Above $71
Final Thoughts
EBAY is trading at a key inflection point. If it can break and hold above $72.50, we could see a gamma squeeze toward $75. However, given its overbought Stoch RSI, a small pullback before continuation would be ideal. Options data supports bullish bias, but traders should watch volume for confirmation.
📢 Risk Management: Manage position size carefully, especially with increased volatility.
🔹 Disclaimer: This analysis is for educational purposes only and does not constitute financial advice. Always conduct your own research and manage risk accordingly before trading.

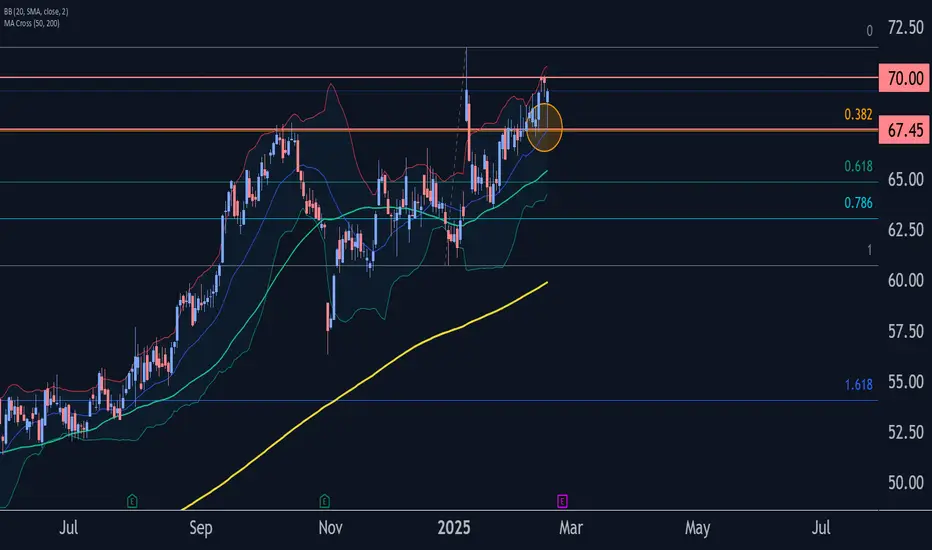
Ebay Wave Analysis – 19 February 2025
- Ebay reversed from the support area
- Likely to rise to resistance level 70.00
Ebay recently reversed up from the support area between the key support level 67.45 (which has been reversing the price from January), lower daily Bollinger band and the 38.2% Fibonacci correction of the upward impulse from December.
The upward reversal from this support area continues the active minor impulse wave 3, which is a part of the sharp C-wave from last October.
Given the clear daily uptrend, Ebay can be expected to rise to the next round resistance level 70.00 (which reversed the price earlier this month).
EBay Seems UnstoppableEBay Seems Unstoppable
From our previous analysis, eBay has surged by nearly 14%.
What’s Next?
You can watch the video for further details.
Thank you!

$EBAY Bullish Trend above ^ $65EBay is a pretty cool company that lets people buy and sell stuff online. They've got a bunch of platforms, including a main marketplace and smaller versions in countries like South Korea, Japan, and Turkey. Plus, they've got mobile apps to make shopping on the go easy. eBay was started by Pierre Morad Omidyar back in 1995 and is based in San Jose, California.
Looking to see NASDAQ:EBAY go above ^$65

Long EBAYGoing with the Squeeze ...
I have collected over the past few days within the high and low range of the 34 exponential moving average.
Targets are Fibonacci 1.272, 1.682 etc.

EBAY GOOD VOLUME This Weekly FORECAST
Opportunity for EBAY. This setup is my trading idea/plan, if you want to follow: trade at your own risk (TAYOR).
Risk Factors:
1. Market conditions, unexpected news, or external events could impact the trade.
2. Always use risk management strategies to protect your capital.
