LONG FCXExpecting bounce from extremely oversold weekly and daily levels. If stop breached, be prepared to catch new daily reversal on lower levels with a tight stop.
FCX trade ideas

FCX buy setupFCX price near to strong support line. possibly buy. wait for abc confirmation. I also watching this one .

LONG FCXExpecting bounce from extremely oversold weekly and daily levels. If stop breached, be prepared to catch new daily reversal on lower levels with a tight stop.
FCX Long Hey Its Rifat Again,
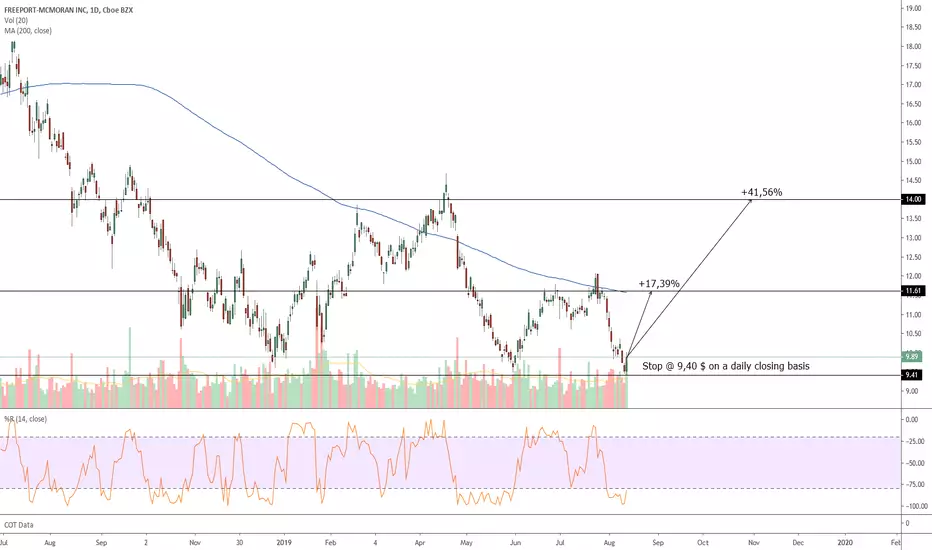
Expecting a 7 weeks breakout.. I will take 5% risk for +22% gain.
Entry- $11.63
Target- $14.20 - $15
Stop loss- daily close below $11.23
thank u very much for being with us.


FCX copper about to make a bull run?I received a tip from a Hedge Fund Manager that this stock will go up to $50.
I did research on Fidility, Schwab, TDAmeritrade, and Ally on this stock. They all say: most said HOLD, some BUY, and few said SELL.
I'm moving my money from my cannabis stocks to this one.
It's earnings is coming out 24th of this month, on Wednesday.
APHA earnings is coming out 8/1, one of my cannabis stocks. I don't think they are going to outperform copper and gold in next 6 months. I think that Federal Gov will continue to make regulations difficult for this industry.
My plan is to scale into FCX. buy some on monday before earnings on wednesday. then depending how it reacts, buy more afterwards. Last earnings was negative, but stock still went higher.
It seems like this stock is in an ACCUMULATION stage based on volume analysis.
Back in 2008 to 2010, it climbed from $10 to $60.
From 2003 to 2009, it had a major bull run with the s&p. Both also tanked during financial crisis. They do not move in tandem. Beta is above 2 (meaning it is twice as volitile compared to S&P. Below shows a chart for this action.

Freeport-McMoran should fall on revised guidanceFreeport McMoran revised its guidance today. The news wasn't all bad, with better productivity than expected, but a lot of it was pretty bleak. The company expects lower copper revenues and higher costs to the tune of hundreds of millions of dollars. The stock broke its upward trendline today, then corrected above the line. It should fall again tomorrow and enter a mid-term downtrend.
I don't play short, but hopefully the short sellers among you will find this useful. Please do your own due diligence; this is just an idea as to how the market will move.


fcx plan. divergence from long time partner..Copper and fcx have had a long, relatively tight relationship. how long will division last?
trade deal? I feel like at some point in near future the words trade deal signed will appear in headlines.


$FCX FREEPORT MCMORAN LOOKS VERY POSITIVEFreeport has mirrored the price of copper and on the 4th of January when copper prices pivoted to the upside FCX began its reversal. this stock has loads of room to run to the upside. The only problem we can see is a breakdown in the Trade talks with China.


Long FCXBottom @$10.00
Strong Earnings and low P/E
Undervalued by current market
Strong Swing potential.


FCX potential longAfter a long turn down, it seems the trend will turn upward. If the stock can break through the level around 12,5 $ the next serious obstacle can be around 15 $. Th technical view is promising.

FCX appraoching resitance, potential drop! FCX is approaching our first resistance at 13.62 (horizontal pullback resistance, 61.8% fibonacci extension, 38.2% Fibonacci retracement) where a strong drop might occur below this level to our major support at 11.53 (horizontal swing low support, 50% fibonacci retracement).
Stochastic (55,5,3) is also approaching resistance where we might see a corresponding drop in price.

OPENING: FCX APRIL 18TH 13 SHORT STRADDLE... for a 1.90/contract credit.
Metrics:
Max Profit: $190/contract
Max Loss/Buying Power Effect: Undefined/~$260 (on margin); full notional (cash secured)
Break Evens: 11.10/14.90
Delta: 31.37
Theta: 1.05
Notes: Implied volatility's still pretty high post-earnings at 42%, so taking a modestly bullish assumption shot with a position that emulates the delta metrics of a 30 delta short put while bringing in more credit, albeit with some upside risk above 14.90. In comparison, the 30 delta shortie in April (the 11 strike) is bringing in .47 with a down side break even of 10.53. I'll look to take profit at 25% max (.48) which would be about an 18.3% return.
