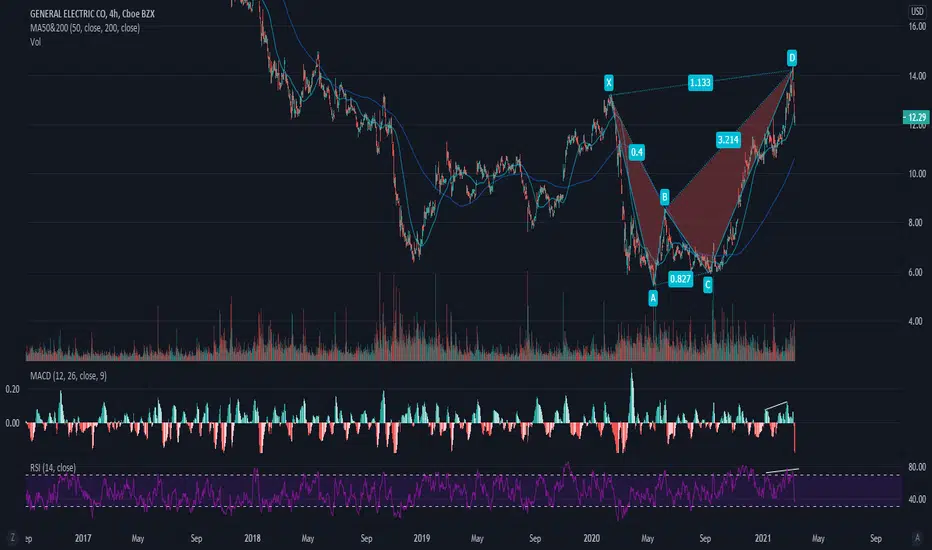
Bearish ALT BAT on GE with Bearish Divergence on Daily on MACD Bearish ALT BAT on GE with Bearish Divergence on Daily on MACD . Bearish Divergence on Daily with Bearishly engulfing candle yesterday and follow through bearish candle today. 3 Black crows on D .Good r.r for Short. Longs take caution. Not financial advise. Do your own DD
GECL trade ideas

Bearish ALT BAT on GE with Bearish Divergence on Daily on MACD Bearish ALT BAT on GE with Bearish Divergence on Daily on MACD . Bearish Divergence on Daily with Bearishly engulfing candle yesterday and follow through bearish candle today. 3 Black crows on D .Good r.r for Short. Longs take caution. Not financial advise. Do your own DD

Bearish ALT BAT on GE with Bearish Divergence on Daily on MACD Bearish ALT BAT on GE with Bearish Divergence on Daily on MACD and RSI. Also bearishly englufed on D yesterday and countinuing its downtrend

GE: The single most important price level for GE!Hello traders and investors! Let’s talk about GE today! It is my first analysis about it, and I hope it helps!
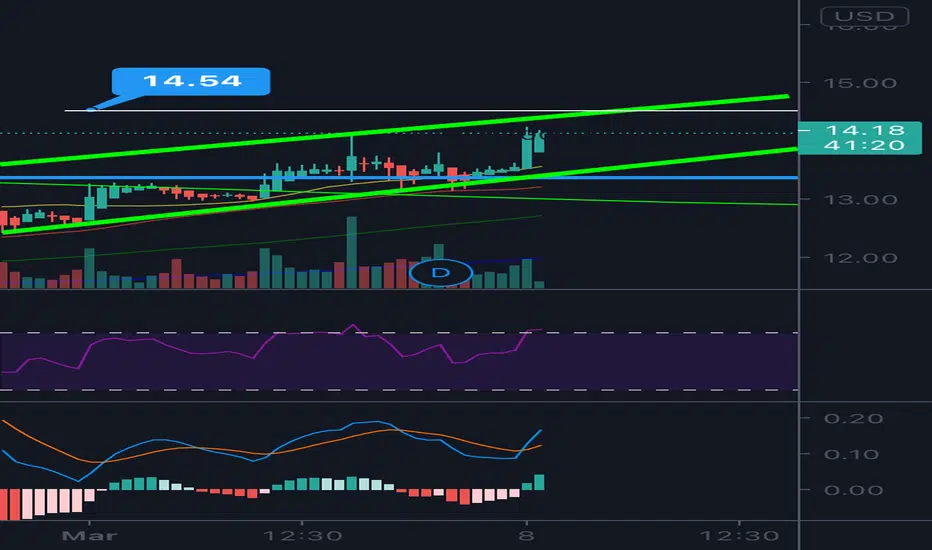
First, in the 1h chart we see that it is trading slightly under the black line at $ 13.27 , which is a Key Point, as it worked as support and resistance alike, in the recent past. If GE loses this point for good, we can expect a sharper pullback in the daily or even the weekly charts.
If this chart pattern confirms to be an Island Reversal , then it is almost certain that it’ll seek lower levels. In order to avoid this scenario, GE must react quickly, and fill the most recent gap in the next upside movement.
Now, let’s see the daily chart:
Today’s candlestick is quite intense, but the day is not over yet, so, we still might see a reaction. But it seems GE is going to seek the 21 ema in the daily chart at least.
The trend is still clearly bullish, and pullbacks shouldn’t be scary at all. The 21 ema is an interesting support level, and any bullish reaction around here could be an opportunity to buy.
The problem is that the pullback might be more intense than we expect. See, the black line at $ 13.27 is still visible here, and it seems it is older than it looks, despite the fact it is still working wonders in the 1h chart. The weekly chart will give us an answer:
Yep, the black line is the top level prior to last year's crash. It is amazing how the market still remembers this price level, and how it works very well in the 1h chart more than one year later.
The problem is, if it closes under this black line in the weekly chart, the market will see this as a Dark Cloud Cover candlestick pattern, and the technical target will be the 21 ema in the weekly chart.
This could lead to a pullback that would last for some weeks, but still, won’t be enough to change the bullish bias seen since Sep 2020. In fact, it could be an amazing opportunity to buy, at a cheaper price.
Let’s be prepared for this scenario and wait calmly for more clues. If you liked this analysis, remember to follow me to keep in touch with my daily studies, and if this idea helped you, please, support it with your like!
Thank you very much!


Timeframe expectations on GE 50 days to 16If the past 60 days are any reflection on GE stock we expect this extension to continute for $GE for another roughly 45 days that would get us comfortably to the 16 dollar range.
An extension above that point is very likely if we continue to see increased air travel and new orders for aircraft (that use the GE engine) and also industrial machinery orders continue to pick up.
With the additional stimulus dollars that are coming into the market, institutional investors could start to switch from growth to value stocks making GE and other staples a perfect option.
We are long from 6.25 and 7.4 respectively looking for a 100% return on this long term trade.

GeHad a great breakout on Friday of 13.60 level daily close. Showing bearish divergents. I have resistance above as high as 14.50. If closes above I will go long I did take profits at 14.20
$GE LONG HOLD INVESTMENT I bought the dip in March 2020. I'm going to hold this for a long time. 5-10 years.

GE LONGGE recent trend seems to be very positive at least technically.
In my opinion there is a good chance that we will see continued gains next week after the correction of the markets this week.
Good luck

Second green daySmall scalp here. Analyst came in with an upgrade, wedge pattern, new 52-week high with first green day yesterday. The market has been indecisive so I left some money on the table. 3/5 14c entered at 16 at 8:35 cst held for 4 minutes closed at 18. Had a high of 27 or 168%, but a win is a win so I'll take my 12% gain.

GE, a multi-year breakout is coming beautiful chart. a break and hold over 14 can initiate a multi-year gap up. Immediate targets are 15, 17.4 area, 20, ad then 30 in long-term.

Buying GE 5 Mar 21 14 CallsIt may be the case that GE is in a strong up trend. I'm expecting price to hold current support and push up past the most recent resistance. I'd like to see this happen within the next 2 weeks.
So, why $14? Old resistance suggests that this price could be the next area for price to find resistance. This resistance was created late May, then tested again in late June and mid July of 2018.

GE road to 14.5, then 16!GE is breaking out of solid resistance, get in this reversal name. New leadership under Culp, new vision, free cash flow improving, this will be 20 dollars in 2022 so get in while you still can go long.

GE GE Technical Analysis
GE brings to market innovative solutions that deliver essential energy, healthcare and transportation infrastructure. We work with the highest integrity, compliance culture and respect for human rights while also reducing the impact of our technology and environmental footprint.
"It's inevitable"
Like, Follow, Agree, Disagree
What do you think?
I got price going $22 and TO THE MOOOOOOON!

GEGE brings to market innovative solutions that deliver essential energy, healthcare and transportation infrastructure. We work with the highest integrity, compliance culture and respect for human rights while also reducing the impact of our technology and environmental footprint.
"It's inevitable"
Like, Follow, Agree, Disagree
What do you think?
I got price going $22 and TO THE MOOOOOOON!

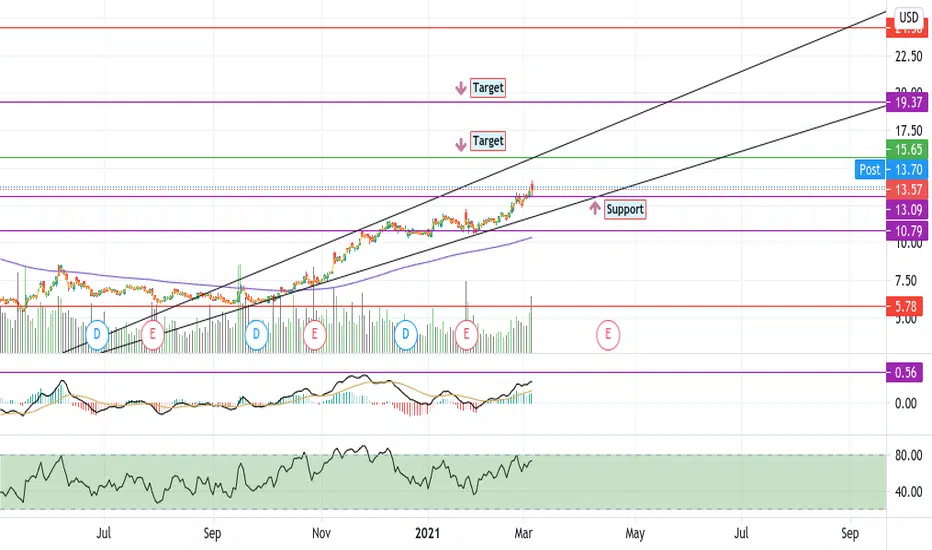
GE LONG this is for long investment 3+ months don't go long until it pass $13.45 if it brake that level than you good to go,
1st target is between 2 and 3 months of wait
2nd target is 4-5 months
3rd target 8 to 12 month
GE is heavy to move but the movement is clear.
you probably will get it to 3rd target with a different age tho but it is good investment.

A safe bet for next week..!Potential gain:12-14%
Reward/Risk:3.5
Timeframe: 1-4 wks
I always try to present the charts in a simple comprehensive format to prevent any confusion.
This is just my technical view, neither a fundamental comment,nor a recommendation to trade..!
Please review my track record and calculate the odds for yourself..!
You’re likes and comments encourage me to continue this.
Stay tuned great live stream and quality content videos coming soon..!

Fundamental outlook has changed for GE..!*increased revenue and earnings!
First target: 13.15
Call option target price:12 , For 19 Feb (0.13)
Please take your time and do your own research..!
Option trading expose you to very high risk of losing your capital.

Make easy money with GEThe next target is 13.20
Look at my previous calls on GE, it was 5.95 when I made the first call on Sep 12 ,2020


GE - unstoppable to 20I will get in above $13.12 and join the uptrend continuation here to the next trendline. This is the window.
Made the first broadcast in the 20s is now heading to the 20s
See my profile for more charts like these!
