What just happened to Google? 9.40% crash and more to comeWell that was unexpected.
According to my sources, Google came out with positive results (despite them not being as good as Microsoft). And yet the price crashed already 9.40% without the fail safe switch on yet.
Technically, it's formed a Breakway gap.
These don't close as quickly as other gaps, but if the trend stays down.
It is likely to head to $111.50 next.
The M Formation that failed to break above the resistance also shows the bear trend for the market.
So do you know what happened to Google? Or is this Smart Money buying the heck out of it?
I doubt it...
GOOGCL trade ideas

How is the google chart bullish?Not sure about you, but #Google violated a bunch of technical support levels on smaller time frame charts.
Not something you should normally see in a strong bull market.
#fintwit #inflation #rotation #nasdaq

GOOGLGOOGL not looking good after reporting earnings. Gapped down after earning and sitting at a critical level. If it can't hold, its heading down to $110 again and bringing the rest of the market along


GOOGLE Almost oversold at the bottom of the Channel Up.Google is having a rough day following the revenue miss and has found itself at the bottom of the 5 month Channel Up.
This is a buy opportunity, as long as (1d) candles close inside the pattern.
Trading Plan:
1. Buy if the (1d) candle closes inside the Channel Up.
2. Sell if it closes under it.
Targets:
1. 146.00 (+15.50% rise, like the first bullish leg of the Channel Up).
2. 120.00 (estimated course of the MA200 (1d)).
Tips:
1. The RSI (1d) gives the most optimal buy opportunity at the bottom of its Channel Down around the 30.00 oversold level. Keep that in mind in case it coincides with a MA200 (1d) contact.
Please like, follow and comment!!

Google Bearish for limited timeChart currently shows Bearish Signal as per the following reasons:
Indicators:
1. Slight Dark Cloud cover indicated
2. Two Black crows, today's trading will indicate if three black crows are confirmed.
3. Slight Bearish divergence
Patterns:
1. Bearish rising wedge on graph - indicates a potential bearish signal
Bullish After Cup and Handle Formation
Although it seems that perhaps the bearish trend may be limited to form a cup and handle pattern, once handle is broken - uptrend to continue.

Google earnings tomorrowAlphabet Q3 September 2023 earnings are on Tuesday 10/24/23 at 4pm. Alphabet (GOOGL) reported earnings of 1.44 per share on revenue of 74.6 billion for the second quarter ending June 2023. The consensus earnings estimate was 1.32 per share on revenue of 72.77 billion. The company beat expectations by 4.35% while revenue grew 7.06% on a year-over-year basis.
Q3 September 2023 Consensus:
EPS = 1.45
Revenue: 75.91B
Moving averages:
VWMA 50 = 134.16
VWMA100 = 128.53
VWMA200 = 113.08
TTCATR20:
R3 = 145.38
SMA20 = 135.67
S3 = 125.96
Options data:
10/27 expiry
Put Volume Total 11,785
Call Volume Total 35,522
Put/Call Volume Ratio 0.33
Put Open Interest Total 45,954
Call Open Interest Total 69,755
Put/Call Open Interest Ratio 0.66
11/03 expiry
Put Volume Total 1,887
Call Volume Total 4,703
Put/Call Volume Ratio 0.40
Put Open Interest Total 14,808
Call Open Interest Total 18,971
Put/Call Open Interest Ratio 0.78
11/10 expiry
Put Volume Total 947
Call Volume Total 1,308
Put/Call Volume Ratio 0.72
Put Open Interest Total 7,864
Call Open Interest Total 12,607
Put/Call Open Interest Ratio 0.62
11/17 expiry:
Put Volume Total 6,291
Call Volume Total 17,778
Put/Call Volume Ratio 0.35
Put Open Interest Total 136,564
Call Open Interest Total 139,669
Put/Call Open Interest Ratio 0.98

Google Set to Announce Positive 3Q Earnings - Time to Long GOOG!I am thrilled to share with you that Google (GOOG) is anticipated to announce positive 3Q earnings, and I couldn't be more excited about the potential this brings for all of us.
Google, being one of the most influential companies in the tech industry, has consistently demonstrated its ability to innovate and adapt to the ever-changing digital landscape. With its diverse range of products and services, the company has managed to maintain its position as a global leader.
Now, with the upcoming release of 3Q earnings, we have a golden opportunity to capitalize on Google's success. The positive financial outlook signifies that the company is not only thriving but also well-positioned for future growth. This is a clear indication that GOOG is a stock worth considering for a long position.
As traders, it's crucial to stay ahead of the curve and seize opportunities when they arise. By going long on GOOG, we can potentially benefit from the positive momentum generated by the anticipated earnings report. This is an exciting prospect, and I encourage all of you to seriously consider taking action and adding GOOG to your portfolios.
Google's unwavering commitment to innovation, coupled with its strong financial performance, makes it an attractive investment option. The company's diverse revenue streams, including advertising, cloud services, and hardware, provide a solid foundation for continued growth and profitability.
So, let's embrace this moment of positivity and take advantage of the potential gains that lie ahead. I urge you to conduct your due diligence, analyze the market trends, and consider the long-term prospects of GOOG. By doing so, we can position ourselves to ride the wave of success alongside Google.
Remember, timing is crucial in the world of trading, and this could be an opportune moment to go long on GOOG. So, let's seize this chance and make the most of it together.

GOOG Sympathy Move Ahead of Earnings TodayThe run down to Monday was a sympathy run. It doesn't mean that NASDAQ:GOOG is headed for a bad report. Rather, retail investors are selling ETFs or moving money out of stocks into safe havens, or other adjustments to portfolios and 401(k)s. The selling dug into the most recent weak support level.
However, NASDAQ:GOOGL has not sent out any advisor in recent weeks regarding its earnings report. Any company this size, and as a veteran company of the stock market, would warn if earnings were going to miss the retail-side analyst estimates. So this is a sympathy move merely because the retail-side selling is moving big-name companies down at this time.
If it has a great earnings report, which the previous runs suggest , then the HFTs may trigger a gap up at open tomorrow. Alphabet had improvement in its quarterly report last quarter. Yearly revenues have been up for 4 years but earnings are up and down as it invests hugely in AI.

Google turns the corner as investors await earningsNASDAQ:GOOGL parent company Alphabet is set to report its Q3 earnings with analysts expecting an upbeat report from the tech company.
The internet search giant is expected to see its EPS jump by 37% to $1.46 while gross earnings for Q3 are expected to rise by 10% to $ 76 billion. Analysts are forecasting a rebound in the Ad business revenue with YouTube advertising set to rake in about $ 7.82 billion, indicating a 10% rise with upbeat reports also expected in its cloud computing services.
Investors will be eager to hear about the company’s progress on Google’s artificial intelligence project as it prepares to launch a new language model called Gemini which is expected to compete with OpenAI’s GPT-4.
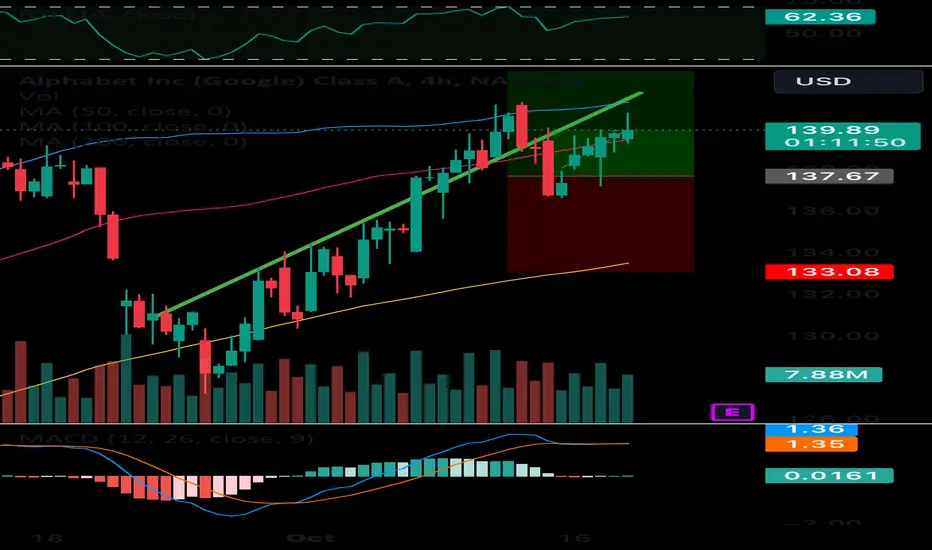
A glance at the chart shows that the correction phase of the bullish trend might have ended as the price made a rebound close to the support area of the ascending channel around $133.00. NASDAQ:GOOGL has benefitted from the AI revolution this year which has seen its stock rise about +54.71% as it competes with other tech giants for superiority.

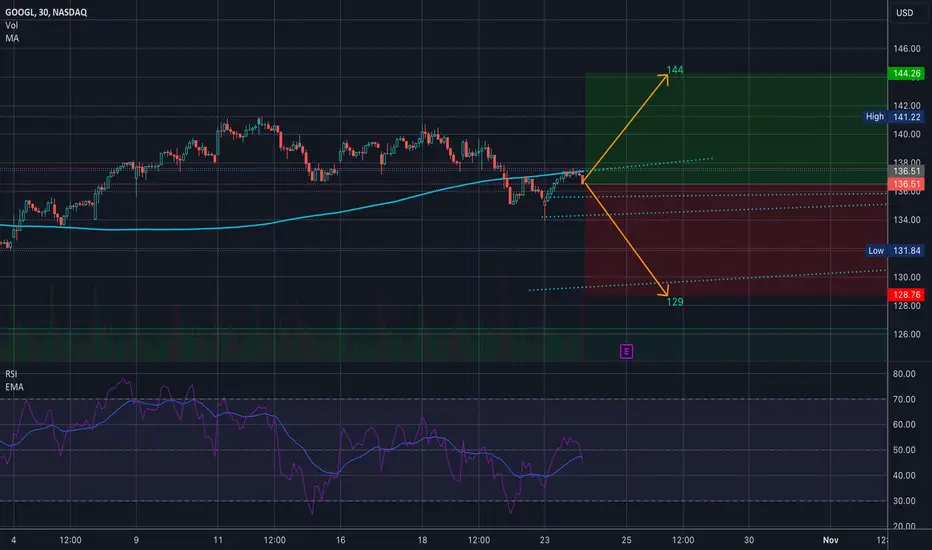
$GOOGL Implied move for earningsNASDAQ:GOOGL Implied move for earnings
As of right now, the implied move for GOOGL earnings is wide. It might shift a little bit with tomorrow’s trading session but I’ll update this idea about an hour to market close….
The implied move is between 129 to 144…
And right now the 30min 200 is resistance, and she’s been making lower highs
One the 1D timeframe there is a severe bearish divergence and the YTD volume profile points to lower… 105 (obviously out of tomorrow's range but it's down there)
💵 E a r n i n g s J o u r n a l📶 S T A T I S T I C A L A N A L Y S I S
Current 50-Day Market Trend: long/buyers/positive.
Next Swing: neutral swing of volatility.
Next Wave: buy wave to the ceiling.
Next 50-Day Market Trend: long/buyers/positive.
Trade Type: Touch & Go don't wait for a close.
💵 E A R N I N G S A T A G L A N C E
Release Date: 10/24 AMC
Quarter: FQ3'23
_______________________________________________
Revenue Anticipations: positive surprise of Revenues.
Revenue Surprise-Confidence: on a scale of 0-9, #3
Revenue 2-Year Trend: the company trend in Revenues is positive.
_______________________________________________
EPS Anticipations: positive surprise of EPS.
EPS Surprise-Confidence: on a scale of 0-9, #5
EPS 2-Year Trend: the company trend in EPS is positive.
_______________________________________________
📝 S Y N O P S I S
🟢BUY: If the earnings report is above the Wall Street consensus, I expect the market will buy the +surprise.
⚪BUY: If the earnings report is released with complicating press, I expect the market will buy the surprise instead of investing in alternative securities.
🔴BUY: If the earnings report is below the Wall Street consensus, I expect the market will buy the -surprise.
🔎 R E S E A R C H D E P T H
Technical Analysis: daily chart.
Fundamental Analysis: EPS & Revenue data.
Press/News: none.
Social Media: none.

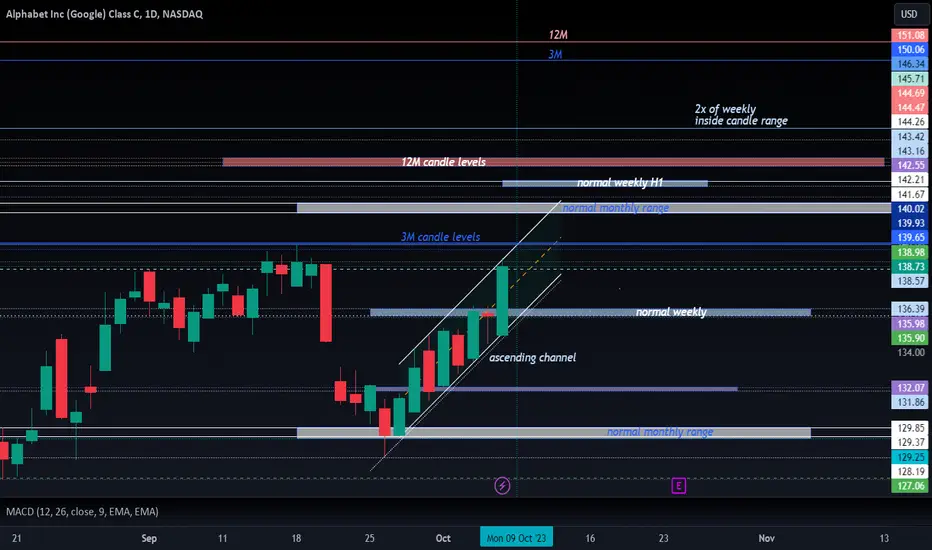
Google enjoyed the positive monthly crossover of 9 MA & 26 MApositive google is following a ascending channel, closed near the top of it, also, nearing a 3M testing level, structure is overall positive, weekly MACD upward split is not prominent, this week movement will give it the required strength possibly, also depends on the overall market strength
7 Mega Cap Tech Stocks Forecast part 2 00:00 Natural Gas stock Bulls NatGas Support & Resistance Guide
04:39 AMEX:UNG Stock Forecast
05:16 USO Oil Stock Forecast
06:27 Gold XAUUSD Stock Forecast
07:21 Silver XAGUSD forecast
06:37 US dollar DXY Stock Forecast
10:37 QQQ Stock Price Forecast
13:36 Sp500 ETF Price Forecast
15:00 Tesla Stock TSLA Forecast Technical Analysis
17:14 Nvidia Stock NVDA Forecast Technical Analysis
18:10 Apple Stock AAPL Forecast Technical Analysis
19:00 Amazon Stock AMZN Forecast Technical Analysis
19:59 Google Stock GOOGL Forecast Technical Analysis
21:43 Microsoft Stock MSFT Forecast Technical Analysis
24:09 Meta Forecast Technical Analysis

GOOGLE: Next stop --> All Time High.Google maintains one of the steadiest trends of the year as not only does it remain on smooth bullish 1D technicals (RSI = 57.789, MACD = 1.700, ADX = 30.881) due to Channel Up 2 since June, but also it maintains Channel Up 1 since the start of the year. The 1D MACD indicates that the stock price has entered a 2 week consolidation phase, whose next leg up would be at least +20.52%, which is marginally over the All Time High (TP = 152.30).
## If you like our free content follow our profile to get more daily ideas. ##
## Comments and likes are greatly appreciated. ##

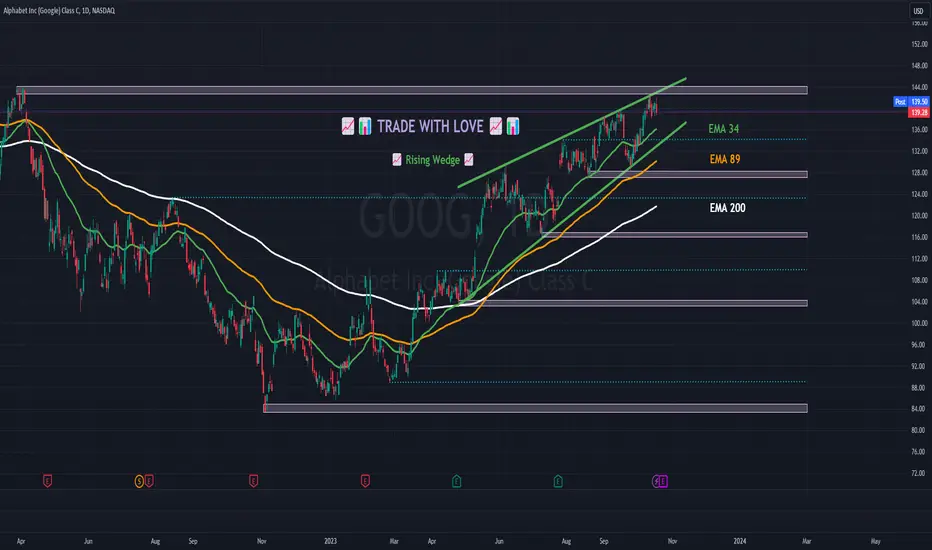
📈📊 #ChartPattern Alert! 📈📊 📈 Rising Wedge 📈📈 What is a Rising Wedge? The Rising Wedge is a bearish chart pattern characterized by two converging trendlines, with the lower trendline sloping upward more than the upper trendline. It typically signals a potential bearish reversal, with the price likely to break downward after the wedge pattern.
📈 How to Identify:
Draw a trendline connecting at least two lower highs (upper trendline).
Draw another trendline connecting at least two lower lows (lower trendline).
📈 What it Signals: The Rising Wedge suggests a potential bearish reversal, with sellers prevailing at lower highs within the wedge. It often forms during uptrends and can precede a significant price move to the downside.
📈 Trade Strategy:
Consider short-selling or setting stop-loss levels if the price breaks below the lower trendline of the Rising Wedge.
Set profit targets based on the pattern's height subtracted from the breakdown point.
Implement a stop-loss to manage risk in case of a false breakdown.
Remember to use other technical indicators and conduct thorough research to support your analysis before making any trading decisions. Happy charting and trading! 📉💹
$Googl - 15 min
2 steps for Bullish Scenario with T1S Indicator:
1. Candles Above the Green Line:
• Check that the candles on the chart are positioned above the green line of the T1S indicator. This could be an indication of bullish momentum.
2. Bars Above Zero:
• Ensure that the bars on the T1S indicator are above zero. This condition might suggest positive market sentiment or upward price movement.
2 steps for Bearish Scenario with T1S Indicator:
1. Candles Below the Green Line:
• Verify that the candles on the chart are positioned below the green line of the T1S indicator. This condition may indicate bearish momentum or a potential downward trend.
2. Bars Negative Below Zero:
• Confirm that the bars on the T1S indicator are in the negative territory and located below zero. This setup suggests a negative market sentiment or downward price movement.

RISING WEDGEPrice fell from the 1st rising wedge by breaking the bottom line, but recovered quickly and is now back above the bottom line of the 1st rising wedge.
Another, smaller wedge has formed and price is inside.
Rising Wedges are known to be bearish and can represent too much supply inside the wedge, causing a sell off when the wedge is triggered by breaking the bottom line which is support until broken. This pattern is not valid until the bottom line is broken. Sometimes price can break to the upside from this patter, but in the end the wedge will be broken. This can be a long term pattern.
Both lines slope up and narrow at the apex.
Large cup pattern also noted with EL at 152.20.
Earnings estimated to be on 10-24.
NO RECOMMENDATION

Google and Cambridge renew multi-year partnershipCambridge University and Google have forged a renewed, multi-year partnership aimed at funding and conducting groundbreaking research in the realm of artificial intelligence.
Their focus will be directed towards pressing concerns such as climate, healthcare, security, and the ethical deployment of emerging technologies.
Michele Donelan, the Secretary of State for Science, Innovation, and Technology, has officially confirmed this:
"Artificial intelligence can offer us enormous opportunities - growing the economy, creating new jobs and making lives longer, healthier and happier for British people."
The Magnificent 7 Index : A House of CardsThere are exactly 7 stocks holding up the entire US stock market. Those assets include Alphabet, Amazon, Apple, Meta, Microsoft, Nvidia, and Tesla. What I’ve done here is created an index chart that enables an Elliott Wave count of all 7 assets combined. The all time high was printed in November 2021, along with the rest of the major stock indexes. Since then, these magnificent 7 have carved out a 5 wave expanding diagonal decline, followed by a 3 wave corrective zigzag that ended in July 2023. This is an incredible 1-2 series to begin a massive decline to an all time low below $170 for an index currently valued around $1800. But let’s not put the cart before the horse and instead look at what’s right in front of us. Since the wave 2 high in July, this house of cards has begun to tumble, printing a smaller degree 1-2 decline that is only the beginning of a much bigger fall described in this post.


Google: Bearish Deep Crab Dark Cloud Cover Type 2 Return EntryGoogle, after its initial bearish reaction to the PCZ, has returned to the PCZ as the RSI managed to make a 3rd lower high and is set up to give us an impulsive move downwards in the coming days. We also confirmed a textbook Dark Cloud Cover today after the rejection of the ascending trend line.
I think we will see extreme downside from Google pretty soon that will undo most, if not all of its 2023 upside price action.

GooglRising wedge here and a dark cloud cover daily candle.
Targets are
138 gap close.
Below 138 and we head straight for our 21ema at 135
Below 135 and 130-132 at play here..
Daily Rsi just hit our reversal
XLC sector which is the sector of Meta,googl, and NfLX just hit its supply zone with a bearish engulfing
