Googl absolute buy zoneGoogl is probably my largest future bet going forward. After the most recent earnings and a very thoughtful analysis, I find it to be the best value of the Mag 7, followed by Amazon. I go with A class shares since they offer voting power and are likely more popular. My plan for this stock is to buy 2026 Jan leaps likely around 150$, and sell covered calls against the position. If I am close to assignment I may roll, or allow the leaps to move. I do plan on exercising at least one of these in 2026 at the 150$ range since I believe this is an amazing company.
-165 UPCOM:ISH is an amazing deal, the company was valued at 164 using discounted cash flow model in Q1
-Low forward PE in an overheated market
-Extremely high cash flows
-Expanding cloud revenue
-Slept on in the Ai market, they control the data, therefore their Ai presence will be huge
-Large moat, people like to use google, youtube, and the cloud is expanding
GOOGL trade ideas
GOOG Momentum Long *Potential Setup*This is a potential long on GOOG.
The first leg up has happened which is step one of the setup.
Step two is a tight consolidation channel which I am waiting to see.
Step three would be a second leg up.

$GOOGL still one leg higher? $200+?Judging off of sentiment, I think most people believe that Google will miss earnings.
Based off the chart, I think there's still one leg higher that likely starts on a reaction to earnings.
I think what's likely is we get a retest of support tomorrow and a low into earnings, and then we see a positive reaction after earnings that starts the next leg higher up to $200+.
Top targets are $214-234.
Let's see what happens.

Is it a good time to buy Google?It feels like the bottom for Google in the long term.
(1) The price is touching the long term trend line
(2) Fib retracement is at 0.618~0.65 range
(3) WaveTrend touched the bottom
But what if the trend line breaks?
Maybe $64 will stop it or maybe $50.
Always be ready for the worst case scenario.
Don't go all in nor use leverage because you never know the bottom.

Google's Reverse Head and Shoulder patternI looks like Google stock price completed reverse head and shoulder pattern.
We can expect about 30% price raise.

$GOOG Cup and HandleLittle late to the party here but look to enter on pullbacks with clear stop at halfway point on the cup. Love this pattern, shout out William O'Neil

Google Set to Invests 1 Billion Euros in Finnish Data CentreGoogle ( NASDAQ:GOOG ), a subsidiary of Alphabet Inc., has announced its plan to invest an additional 1 billion euros ($1.1 billion) in the expansion of its data center campus in Finland. This strategic move aims to bolster the company's artificial intelligence (AI) business growth in Europe. The Nordic region, with its cooler climate, tax incentives, and abundant renewable energy sources, has become a preferred location for data centers in recent years.
While some Nordic countries have expressed concerns about hosting data centres, citing the potential use of renewable power for higher value products such as green steel, Finland's significant increase in wind power capacity, particularly a 75% surge to 5,677 megawatts in 2022, has positioned it favorably for accommodating data centres. Google ( NASDAQ:GOOG ) has secured wind power in Finland through long-term contracts, leveraging the country's renewable energy potential.
With the proliferation of AI applications, analysts anticipate a substantial surge in data centres' power consumption. Google's investment in the Finnish data centre aligns with its commitment to operating with 97% carbon-free energy and its plan to redirect excess heat from the data centre to the district heating network in Hamina, benefiting local households, schools, and public service buildings. Furthermore, Google has pledged to achieve net zero emissions across all its operations and value chain by 2030.
In addition to its Finnish investment, Google ( NASDAQ:GOOG ) recently announced its intention to construct new data centres in the Netherlands and Belgium. These initiatives underscore the company's strategic focus on expanding its data infrastructure to support its growing AI and cloud computing operations.
Technical Outlook
Google ( NASDAQ:GOOG ) stock is up 1% to $179 per share trading with a bullish Relative Strength Index (RSI) of 71.99 which is sparsely overbought. The stock is prime for further growth as it is trading above the 200, 100, and 50-day Moving Averages (MA) Respectively.
A move further above the 1-month high to the pivot point will validate new highs for Google ( NASDAQ:GOOG ).

GOOG heads up at $160: record high, possible top/pullback spotGoogle finally made new highs.
Just hit a major resistance cluster.
Watching closely here, could turn.
$ 157.95 - 160.24 is immediate resistance.
$ 149.93 - 150.66 is first good support below.
$ 202.23 - 203.89 is next major target above.
========================================

Google Overbought13 of the giant investment companies were on the side that sells googl in this ranks. I'm on the side of the googl area from $ 176 and I think it looks expensive. I can add it if it descends between $ 145 and $ 124. Especially I chase the candles in which the dfr indicator I have developed gives a scholar signal.


Resistance SupportInvestors are considering the direction of Google's stock. What do the charts indicate about its direction, and what are the signs for profit-taking? How would you make your decision?

OpenAI’s search engine: Implications beyond GOOG stockOpenAI has denied rumors claiming it's set to reveal an AI-powered search engine for its flagship chatbot, ChatGPT, on Monday.
Although there is speculation that OpenAI is being a bit of a wise guy, and the product it will demo is not a search engine, but what they might dub as the next generation of search engines.
It will be interesting to see if this product, whenever it is first demonstrated, is anything Google will have to worry about. According to Bloomberg, OpenAI’s search tool will be partly powered by Microsoft’s Bing search engine. Make of that what you will.
Either way, this could likely ratchet up competition with Google and the market might have already begun to price in this risk to GOOG stock. But what other stocks could face a negative or positive risk from this development?
Maybe we can ask ChatGPT:
“Online advertising companies: Companies that heavily rely on Google's advertising platform for revenue could face challenges if advertisers shift their budgets to the new search engine. This includes companies like The Trade Desk (TTD), Magnite Inc. (MGNI), and Criteo S.A. (CRTO).
E-commerce platforms: Google's search engine is a major source of traffic for many e-commerce platforms. If a rival search engine gains popularity, it could impact the flow of traffic and potentially affect revenue for companies like Amazon (AMZN), eBay Inc. (EBAY), and Shopify Inc. (SHOP).
Payment processing companies: Google's search engine facilitates e-commerce transactions, which benefits payment processing companies like PayPal Holdings Inc. (PYPL) and Square Inc. (SQ). If a rival search engine affects e-commerce traffic patterns, it could indirectly impact payment processing companies.
Digital marketing agencies: Companies that specialize in search engine optimization (SEO) and search engine marketing (SEM) services may see a shift in demand if advertisers allocate resources away from Google towards the new search engine. Examples include companies like WPP plc (WPP) and Omnicom Group Inc. (OMC).
Data analytics companies: Google's search engine generates vast amounts of data, which is valuable for analytics purposes. If a new search engine captures market share, it could impact data analytics companies that rely on Google's data for insights. Companies like Nielsen Holdings plc (NLSN) and The Dun & Bradstreet Corporation (DNB) could be affected.
Online review platforms: Google's search engine plays a significant role in driving traffic to online review platforms like Yelp Inc. (YELP) and TripAdvisor Inc. (TRIP). A new search engine could potentially change the dynamics of online reviews and impact these platforms' user base and revenue streams.”

$GOOGL Long IdeaBuilding off my gap fill/support idea i posted we look to take NASDAQ:GOOGL long over $155

Discovering profitable stocks for intraday trading █ Discovering profitable stocks for intraday trading: Simplifying the BeSt System
Intraday trading style capitalizes on the market's daily fluctuations to generate profits, appealing to traders seeking quick returns. However, the rapid pace and high associated volatility require precise decision-making and a deep understanding of market dynamics. For intraday traders, the key to success lies in predicting market movements and identifying stocks that offer the best potential for profit within a limited timeframe. The BeSt system , short for Best Stock Finder, is a pioneering approach that uses data analysis to pinpoint promising stocks for daily trades. This article explores how this system works and what it means for the everyday trader.
The primary goal of this research is to unearth effective strategies for selecting stocks that are most likely profitable for intraday trading.
The relevance of this study is particularly pronounced in the current market environment, characterized by heightened volatility and increased trading volumes. These conditions heighten the risks associated with intraday trading and open up new opportunities for savvy traders.
█ Understanding the BeSt System
At its core, the best system employs a sophisticated blend of regression and sequence mining techniques to analyze historical stock data. By examining patterns in stock price movements and predicting future trends, the system identifies stocks most likely to experience significant price changes within the same trading day.
⚪ How Does the BeSt System Work?
Regression Techniques: These algorithms predict future price variations by analyzing historical price data. The stocks showing the highest potential for price fluctuations are highlighted as prime candidates for trading.
Sequence Mining: This method goes beyond simple price predictions by looking for recurring sequences in stock performance. It identifies patterns indicating which stocks are likely to perform well, based on their historical sequence of returns.
Weighted Sequences: By assigning different weights to stock occurrences based on their profitability, the system prioritizes stocks that have consistently shown higher returns following specific patterns.
⚪ Simplifying How the BeSt System Works
Predicting Price Changes: At its heart, the system uses past stock price movements to forecast future activity. Imagine being able to predict a stock’s price rise before it happens—that’s what this system aims to do.
Finding Patterns: Beyond predictions, the BeSt system looks for patterns in how stocks have performed over time, identifying which stocks are likely to do well together or in sequence. This helps in anticipating market movements.
Prioritizing Profitable Stocks: Not all stocks are treated equally; the system prioritizes those that have historically provided better returns following certain patterns.
█ Conclusion: For intraday traders, the BeSt system offers a promising tool that enhances profitability and provides a deeper understanding of market dynamics. Turning complex data into actionable trading insights represents a significant step forward in the quest for optimal trading strategies. As technology and data science continue to advance, the BeSt system is well-positioned to become an indispensable part of every trader's toolkit.
█ Methodology
⚪ Regression Techniques These algorithms predict the value of continuous variables based on the analysis of historical data.The goal is to predict the daily percentage variation in the price of a stock on the next trading day by analyzing the historical prices of market stocks on the preceding days. Stocks with the maximal predicted variation are recommended as the most tradeable on the subsequent trading day.
Data Preparation: The historical price data of various stocks are collected, focusing primarily on daily percentage variations in stock prices.
Model Training: Regression algorithms are used to create predictive models. These models analyze the historical prices and try to forecast the price movements of the stocks for the next trading day.
Stock Selection: Stocks predicted to have the highest percentage variation in their prices the next day are flagged as potential candidates for trading. This prediction is based on the regression model’s output, which calculates the expected price change from one day to the next.
⚪ Sequence Mining This involves the use of unsupervised data mining techniques to discover recurrent sequences of items in large datasets. In this context, items are stocks, and the time stamps correspond to the closures of consecutive trading days. A sequence is an ordered list of itemsets, where an itemset is a set of items occurring at a given time stamp. Given the best-performing stocks on past and current trading days, a sequence indicates that if an arbitrary set of stocks is in the top list on preceding days, a given stock is likely to occur in the top list on the next day. Weighted sequences, rather than traditional ones, are used to weigh differently the occurrences of different stocks on the same trading day according to their daily profits.
Data Handling: The process starts with collecting historical stock data, particularly focusing on the closing prices across consecutive trading days. This data is then prepared into a sequence format where each sequence represents the ordered list of stock performances over multiple days.
Mining Process: Using sequence mining algorithms, the system searches for common patterns or sequences in the stock data. These patterns reveal which stocks frequently perform well in sequence—meaning if certain stocks are performing well today, which stocks are likely to perform well tomorrow based on historical patterns.
Weighted Sequences: To refine the selection, the concept of weighted sequences is applied. This approach gives different weights to the occurrences of stocks based on their profit performances on particular days. For example, if a stock consistently shows higher gains than others on specific days following certain trends, it will be weighted more heavily in the predictive model.
Stock Recommendations: The system identifies sequences with the highest recurrence and profitability. Stocks appearing in these sequences are recommended for trading. These stocks are expected to perform well in the short term, aligning with intraday trading goals.
█ Data Set Used
The data set used for this study consisted of a broad range of stocks across various sectors, including technology, finance, and consumer goods. To ensure the reliability of the data, the study focused on stocks listed on major exchanges like the NYSE and NASDAQ.
█ Key Findings
High Profitability: The BeSt system outperforms traditional stock selection methods like Support Vector Machines, Linear Regression, and random selection strategies. The sequence-based strategies used by BeSt, in particular, have proven to yield higher profits, demonstrating the system's ability to effectively identify the most promising stocks for intraday trading.
Effective Trend Capture: The system is highly adept at identifying underlying trends in stock price movements. This capability allows traders to make informed decisions based on a solid analysis of historical data, ensuring that trades align with the most likely future movements of the market.
[* ]Scalability: The BeSt system can handle large datasets efficiently, making it suitable for analyzing the numerous stocks listed on major stock exchanges. This scalability is crucial for intraday traders who need to quickly sift through vast amounts of data to identify trading opportunities.
Interpretability of Results: Unlike many other data-driven trading systems, the BeSt system provides interpretable results. This feature is particularly beneficial for traders who prefer to understand the logic behind the recommended trades. The system's transparency helps build trust and allows users to learn from the system's insights.
█ Practical Applications
Even if you don’t have access to the BeSt system itself, understanding its principles can improve how you approach trading:
⚪ Look for Patterns: Start tracking how certain stocks perform in relation to each other and over various days. You might begin to notice patterns that can guide your trading decisions.
⚪ Use Available Tools: Many trading platforms offer basic tools for analyzing stock trends and predicting movements. Use these to start making more informed decisions.
█ Limitations
While the findings of this study are valuable, they come with limitations that traders should consider. The study focused on large-cap stocks listed on major exchanges, which may not apply to smaller-cap stocks or those on less liquid markets. Additionally, the historical data may not fully account for the market's future conditions as market dynamics continually evolve.
█ Reference
Baralis, E., Cagliero, L., Cerquitelli, T., Garza, P., & Pulvirenti, F. (2017). Discovering profitable stocks for intraday trading. Information Sciences, 405, 91-106.
-----------------
Disclaimer
This is an educational study for entertainment purposes only.
The information in my Scripts/Indicators/Ideas/Algos/Systems does not constitute financial advice or a solicitation to buy or sell securities. I will not accept liability for any loss or damage, including without limitation any loss of profit, which may arise directly or indirectly from the use of or reliance on such information.
All investments involve risk, and the past performance of a security, industry, sector, market, financial product, trading strategy, backtest, or individual's trading does not guarantee future results or returns. Investors are fully responsible for any investment decisions they make. Such decisions should be based solely on evaluating their financial circumstances, investment objectives, risk tolerance, and liquidity needs.
My Scripts/Indicators/Ideas/Algos/Systems are only for educational purposes!

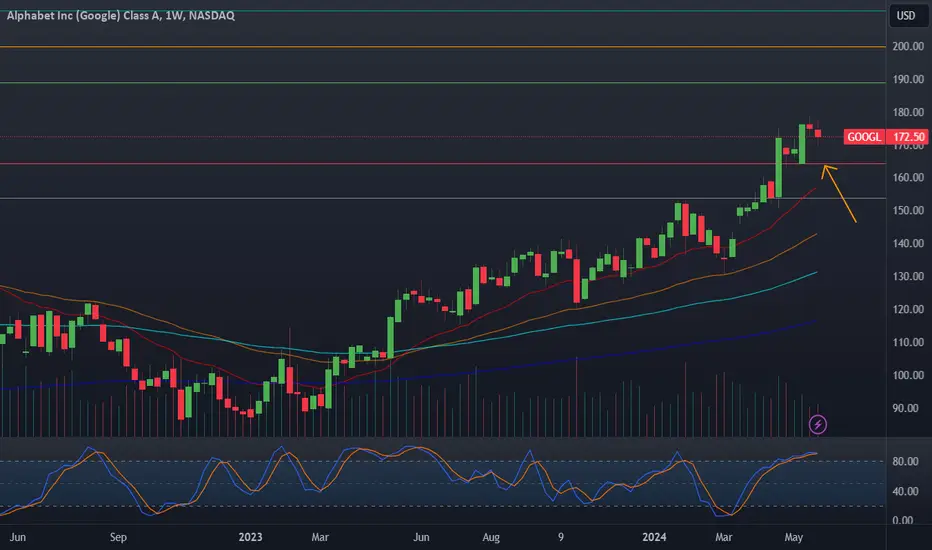
GOOGL April 26, 2024: Lessons Learned After EarningsAs you can see in my related ideas section, I opened a position in NASDAQ:GOOGL on April 1, 2024 and decided to sell my entire position around April 15-18. Therefore I missed the upside on breaking out after earnings.
Here are the main reasons why I decided to sell.
The overall market was very weak during that time. The main indices NASDAQ:NDX , SP:SPX just started to break down their own MA-50
There are many earnings coming out this week.
My position was opened on April 1 therefore I did not have any significant profit in it to hold through earnings
So now what is the plan?
Breaking into new high out of a large base is an opportunity to buy for trend-following traders. Therefore I will open a new position here with NASDAQ:GOOGL , or even better if it will pull back to little to the previous resistance (the yellow line on the chart)

what would topping out look likethis steady slide from the new high has signaled clear signs of daily consolidation for large tech stocks like google. if this wyckoff distribution completes we will end up in a trend not unlike what ive outlined.
the volume weight average signals have trended lower all week so far. i would imagine this continues, with some regressive upward bear contractions approaching upper channel.
the regressive mean is a slide from the new high to our current average.
this 4hr trend is compatible with history, and the new volume weighted average data according to the algo.

Secrets of success on the American stock marketSnapchat ( #Snapchat ) shares surged by 27% to $14.5 per share, following the post-market trading on the New York Stock Exchange on Friday, April 26. And they continue to climb this week:
Several factors contributed to this rapid growth:
Demand for Snap shares increased after the release of financial results. Snap noted that its business is growing faster than expected, thanks to the update of its advertising system and higher demand for features that help brands increase sales or clicks on websites.
In the first quarter, the number of daily active users (DAUs) grew by 10% to 422 million. According to StreetAccount, analysts expected 420 million users. Snap also expects to generate revenue of $1.23 billion in the second quarter, higher than analysts' expectations ($1.22 billion).
The company's revenue per user increased on a yearly basis for the first time since the beginning of 2022, reflecting the recovery of the advertising market and Snap's efforts to revive growth, said Morningstar analyst Michael Hodel.
Simultaneously with Snapchat's success, Tesla (#Tesla) shares began to soar sharply on news that Elon Musk, during his visit to China, reached an agreement with the Chinese technology giant Baidu (#Baidu). The companies will collaborate in the field of mapping and navigation, allowing Tesla to use its Full-Self Driving (FSD) software in China for fully autonomous driving. As a result, the electric car manufacturer's shares rose by 7.98% to $181.72 in pre-market trading on April 29.
Google (#Google) also made headlines by announcing its market capitalization. The market cap of Alphabet, Google's parent company, exceeded $2 trillion for the first time, reaching $2.15 trillion. According to TradingView, Alphabet now ranks fourth in the world by market capitalization. It is surpassed only by Microsoft ( #Microsoft ) with a market cap of $3.02 trillion, Apple ( #Apple ) with a market value of $2.61 trillion, and NVIDIA ( #NVIDIA ), whose market capitalization is $2.19 trillion.
And we remind you that the shares of these companies and many others are available for trading in our trading terminal. Still hesitating where to invest? FreshForex analysts have repeatedly pointed out the prospects for gold and bitcoin, and the forecasts have come true. And now is the time to invest in the fund. Earn with us!

Alphabet (Google) - 330% Rally ahead!Hello Traders and Investors, today I will take a look at Alphabet.
--------
Explanation of my video analysis:
About 8 years ago Alphabet stock created the first retest and rejection of the long term ascending bullish trendline. Then we had a lot of retests of this trendline, the last one being in the beginning of 2023 and this retest was followed by another decent bullish rejection. Last month Alphabet stock broke out of an ascending triangle formation and is now just very very bullish.
--------
Keep your long term vision,
Philip (BasicTrading)

Google just broke out time to load this sharegood chance to reach 150 stop loss as shown in the chart.

Google : Momentum tradePlease check chart for details.
TARGET : 165
STOP LOSS: 135
**These are my personal observations. Please trade at your own risk.**

Technical Analysis Report: Alphabet Inc.Alphabet Inc. (Class C) shares have displayed a notable trend and volatility that provide a rich ground for technical analysis. Based on a detailed examination of various technical indicators, candlestick patterns, and moving averages, this report aims to provide potential trading insights and speculative price targets for both short-term and long-term investors.
Current Price Action and Key Observations
Recent Movement: The stock has shown a bearish trend in the latest trading sessions with noticeable red candles on the daily chart, indicating selling pressure.
Candlestick Analysis: The appearance of multiple bearish candles suggests a potential continuation of the downward trend, especially after a rejection from the high of approximately $175.
Volume: Trading volume has been relatively stable, with recent days showing a mix of above-average selling, hinting at increased bearish sentiment.
Moving Averages and Trend Indicators
Simple Moving Averages (SMAs) and Exponential Moving Averages (EMAs):
Short-term SMAs (5-day and 10-day): Currently positioned above the latest price, indicating a potential resistance zone around $166 - $168.
Long-term EMAs (50-day and 200-day): The price is above these averages, suggesting an underlying bullish trend over the longer term, with critical support levels at approximately $160 and $146, respectively.
Technical Indicators and Oscillators
MACD: The Moving Average Convergence Divergence (MACD) indicates a buy, suggesting potential upward momentum if the market sentiment shifts.
RSI: The Relative Strength Index (RSI) is near neutral at 55.7, indicating neither overbought nor oversold conditions, providing room for both upward and downward movements.
Stochastics: Both Stochastic RSI and regular Stochastic indicators are neutral, signaling uncertainty in price direction in the immediate term.
CCI: The Commodity Channel Index (CCI) hovers around the zero line, further confirming the ongoing indecision in the market.
Price Prediction and Trading Strategy
Short-term Strategy (1-2 Weeks):
Buy Trigger: Should the price rebound and hold above the EMA 20-day ($162.71), accompanied by a positive turn in MACD and a break above a Stochastic value of 60, consider a buying position with a target of $170.
Sell/Short Trigger: If the price fails to hold the EMA 20-day support and drops below $160, consider a short position with a target of $155, closely watching the $158.77 pivot (S1) for potential bounce-back.
Long-term Strategy (3-6 Months):
Buy Trigger: A sustained hold or bounce from the 200-day EMA ($146.38) would be a strong buy signal, targeting a long-term return to highs around $175 - $180.
Sell Trigger: A breach below the 200-day EMA should be viewed cautiously, potentially signaling a deeper correction with a target around $140, marked by historical support levels.
Conclusion
Alphabet Inc. currently stands at a critical juncture where short-term bearish pressures are wrestling with a long-term bullish undercurrent. Traders should employ a vigilant approach, ready to adapt to the quick shifts in market sentiment that are characteristic of tech stocks. The recommended price targets and triggers are speculative and should be used as guidelines alongside comprehensive risk management strategies to protect against unexpected market movements.

GOOG :SUMPERMILLENNUMNice to meet you. SEOVERIGN - This is SeoVerign.
Google has recently flown into AI-related issues.
I've already had a bearish view before I hit the $155 high
The recent gains have made the bearish view even stronger.
The rise seems to have been driven more by basic factors than technical factors.
So this rise appears to be a bubble and is considered to start falling soon.
Google and U.S. tech shareholders seem to be on high alert.
I hope you have a good health.

The Best Months of The Year to Invest in US Stock to Make Money This video will show you the best months of the year you should be investing in US stock market.
In the video, I showed proof that this method works almost every time.
But if you feel you need me to guide you further on how to manage your investment portfolio, feel free to send me a DM now.
If you find this video helpful, give it a like, drop comments, and share it with your friends.
