HAL trade ideas
Halliburton Bottom Weekly candle chart....
Halliburton obviously has a large exposure to crude oil prices (see my publication "Crude Oil Bottom"), so a bottom in crude should correspond to a bottom in HAL.
The almost 7 year support line has held to date and provides an added element of safety.
HAL underwent a perfect fibonacci retracement. In this case the retracement was the "grand-daddy" 61.8% retrace, also know as the golden ratio.
Notice the weekly MACD, which is in the process of a bullish cross.
Although HAL has a relatively low dividend for the energy sector, the P/E looks very attractive; a buy from this level will likely yield a significant and rapid profit.

HAL, DXY, OIL FUTURES, AND IWM 2008 and NOWSo many similarities remain from 2008 and now, have to say them, and play them...
Oil started to crash, HAL its economic representative did also, and the dollar jumped upward historically, gold plunged.
Preceeding all that was a very nice ABC wave, and the same happened in 2011, and the same happened before this last bull run.
Then we went down hard in a clear ABC, as he dollar headed up, the markets lagged a bit, then turned down.
Remarkable how the B of the abc uptrend coincides with the C of the abc downturns. and both of these pivot points coincide with the long term support lines, which were broken at C. I have offset the most recent ABC down so you can see the chart lines.
The thin red vertical lines represent where we are now, and were we were in 2008 that relates to now.
Note the MACD has room to run lower (for HAL) as well as the RSI.
If you measure the AB and CD legs of these moves, HAL should , if we repeat 2008, head toward D as shown.
I believe we are in the green circles now, and NOTE the red triangle hard V, both just recently and 20087, right before the markets crashed. There have not been that many hard V's over the past 15 years, and these two seem to be the most pronounced and the up leg is straight as an arrow. I believe this last V pivot was simply because of algoryhtmic trading, because we reach the long term trend support line, and wammo, bounced right on que. However, Oil is having its own ideas and its say.
So unless something different happens, and opec decided out of character to cut, we go lower. And the markets have to follow at some point.
Heard Cramer say after this last employment report, being so good that there are no more hurdles or events to drag the markets down until after the new year, not even a government shut down from the budget funding battles. He says its happy sailing for the next 30 days at least. I say, he's a fool. There is way too much turnmoil everywhere, and all it takes is one idiot from one of the many groups protesting whatever, in whatever country (take your pic), to set off something that strikes fear to the markets. Jamie Diamond said, the thing that keeps him up at night is the thing that he cannot see coming, to wreck the ship.
The EURUSD wants to go higher, and has been held down way too long. The dollar could go higher, and if oil keeps on sliding it will until its inevitable doom, and crash lower with the rest of world wide assets, and it may be the last to fall. Heck, the dollar could also crash come Monday too, not sure.
There is way more I could say, but the chart says it all for now. How can you look at this and not say it has some merit.
I called for HAL to reach 40 a while back and it has. Made a few bucks on those nice moves (12X). I laid in some calls to retest 47, and decided to bail on that, glad I did. HAL (and CAT) should have retested, and THEY DID NOT! If oil were to bounce here, the bull might still have some legs, but I don't think it does, and we head at least down, maybe to the IWM new channel support trend line. The dollar could go higher, and jobs could increase, but since the FED knows they CANNOT RAISE RATES, wage inflation kicks in way sooner than anyone thought, heck its already kicking in now, that GOLD senses it and pops, and the markets smell it quick, and the bull is abandonded, selling to save the great profits earned during the run.
Safe trading everyone. These are just my opinions, for what they are worth.

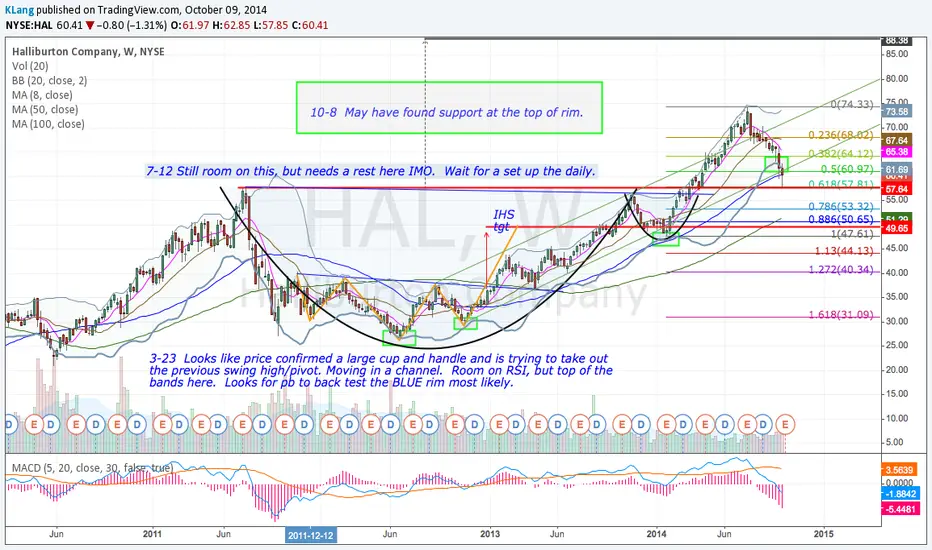
HAL at a moment of decisionThe entire oil industry has reached a pivot point. We have long term trend support (red), shorter term trend support (blue), horizontal supports (major - purple). To say I am watching this carefully is an understatement. Oil has still room to run lower, perhaps to 67-68 per barrel, and if that does happen, HAL breaks its major support here, and heads toward one of the longer term support lines. But it also could go sideways, and also in fact bounce. Watching the Opec news, etc. Also, watching the USDJPY and IWM action. NOT a coincidence they are acting alike right now.

Struggling to break backWe have 2 head & shoulder in this uptrend channel all the way up from Jul 2013!
Now, ever since HAL broke down from the uptrend channel, it has been struggling to break back above the channel.
With major indices in US so strong, HAL is not making progress, if the challenge to blue region is not successful and get rejected, we going to see another leg of plunge
Blue line is my anticipation of price movement


HAL , crazy? You decideAm I crazy, wait don't answer that... taking a couple liberties here, but looks awfully similar. And why do we even post stuff on this website? Yes, to help each other make money, save money. All I am saying is... I would NOT be long HAL right now, and if oil prices continue to go lower, and Fracking being profitable above $100 barrel, maybe oil production slows, sign of economy, a long way from McDonalds (Marker Faber thinks McDonalds in big trouble) going bust but....

HAL versus IWM comparison 2001 to nowIf we are being honest, and if (two big "ifs") we are to repeat the swoon of 2011, by percentage of drop , at the levels we are at now, versus in 2011, this chart is NOT THAT FAR FETCHED. I know this looks extreme, given the VIX levels now, and you will just laugh, but... being honest, there's a part of you that agrees this could happen, right? I've heard more than one major talking head say that watching HAL is always key to market intensity and direction, hey, its the world. Maybe we don't mirror it, but when do we ever do exactly. IMO we are in this ballpark right now, we just don't know it yet. FED, BOJ, and ECU banks think they control their economies, like they are playing a video game and they have the one and only controller in their hands. FOOLS! There is no FEAR or GREED buttons. They play themselves.

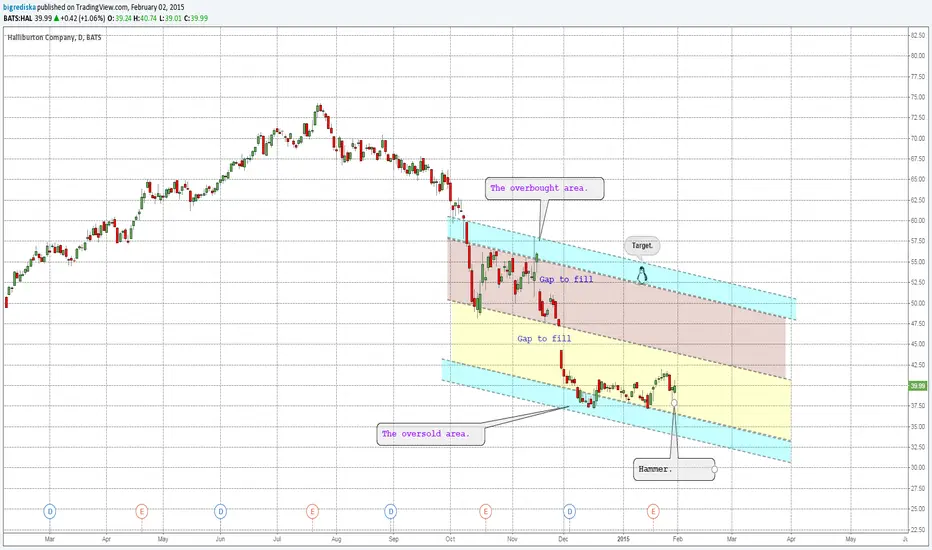
HAL Back to $70Bullish Piercing Candle at support on above average volume at channel support with momentum divergence. We had a higher low recorded on the MACD histogram as well. I am looking for HAL to retest its next resistance level at $70. With stop losses below the low of Friday the trade gives you a 1.5R.

HAL - MACD crossover, 100 day SMA support, Move back to highs.Low MACD crossover
End of ABC Correction
Entire energy space looks to be ready for a higher move.

Halliburton Company - Another stock going to its topThis stock has been in an amazing uptrend. Right now, it's either the start of distribution or this was just a correction, it's too early to tell. Depending on how this stock will act at the top, we will be able to tell which one it is.
Bullish divergence on the histogram, bullish divergence on the FI and a triple bottom formed. Expect at least 74$.

Halliburton UpdateA lot of bullish sediment out there - makes me think a correction is on the way. The chart looks dangerous - expecting a correction of some sort is soon

Cap and Handle long term bullish pattern forecastHalliburton is in a long-term uptrend and has had another nice run higher since the start of February. The price is currently rally, beyond the former 52-week high, between $57.77 and $56.50. The price breaks higher and indicates this current up-leg is continuing.


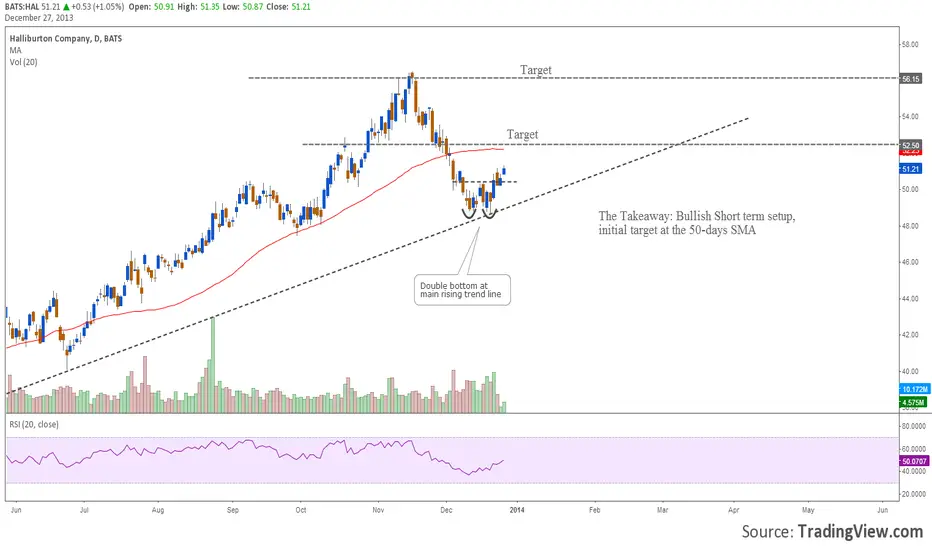
HAT Short Term Bullish SetupHAL ** Shares completed a double bottom reversal at the main rising trend line, hints for potential gains