$INTC with a Bullish outlook following its earnings #Stocks The PEAD projected a Bullish outlook for $INTC after a Negative over reaction following its earnings release placing the stock in drift C
If you would like to see the Drift for another stock please message us. Also click on the Like Button if this was useful and follow us or join us.
INTCCL trade ideas


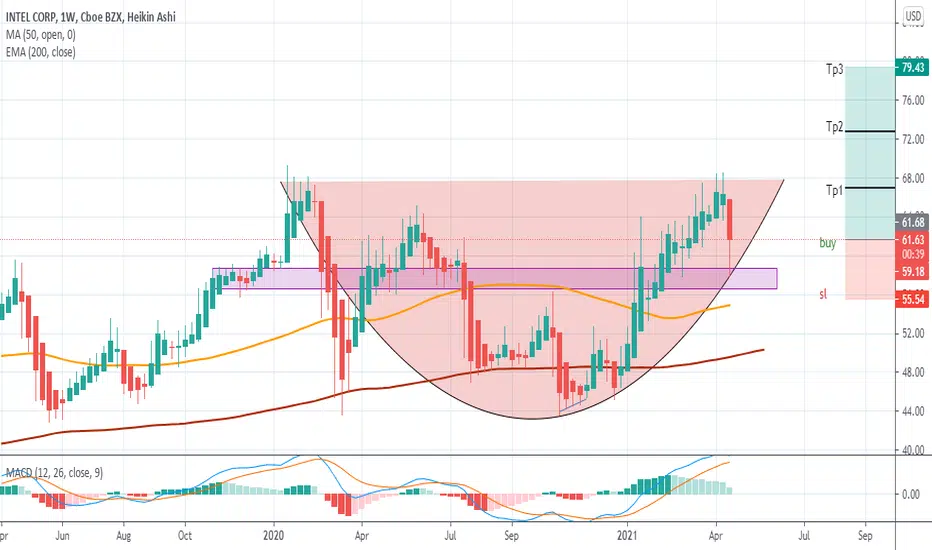

Intel (INTC) First quarter results beat estimates and company raised the full-year outlook. Revenue was flat on the year at $19.7B. EPS was $1.39, $0.25 above estimates. The data center business posted a double-digit percentage decline. We still belive this stock is a choice for the years ahead and offer an interesting appeal for a 3 years investment horizon. Semiconductors are highly complex products to design and manufacture. No other industry has the same high level of investment in both R&D (22% of annual semiconductor sales to electronic device makers) and capital expenditure 26%). Here an interesting report from the Semiconductor Industry Association (SIA), that is the voice of the semiconductor industry in the US.
www.semiconductors.org


Intel Q1 earnings today after market closeIntel (INTC) reported Q4 December 2020 earnings of $1.52 per share on revenue of $20 billion. The consensus earnings estimate was $1.10 per share on revenue of $17.4 billion. Revenue fell 1.1% compared to the same quarter a year ago. The company said it expects first quarter earnings of approximately $1.10 per share on revenue of approximately $17.5 billion. The current consensus earnings estimate is 1.15 per share on revenue of $17.88 billion for Q1 March 2021. INTC moved down -$8 day after Q3 2020 earnings & moved up +$4 day after Q4 2020 earnings.
Q1 March 2021 Consensus:
EPS = $1.15
Revenue = $17.88 B
P/E = 12.7
Div/Yld = 2.13
R3 = $68.39
R2 = $67.11
R1 = $65.73
pivot = $64.45
S1 = $63.26
S2 = $61.89
S3 = $60.60
Do your own due diligence, your risk is 100% your responsibility. This is for educational and entertainment purposes only. You win some or you learn some. Consider being charitable with some of your profit to help humankind. Good luck and happy trading friends...
*3x lucky 7s of trading*
7pt Trading compass:
Price action, entry/exit
Volume average/direction
Trend, patterns, momentum
Newsworthy current events
Revenue
Earnings
Balance sheet
7 Common mistakes:
+5% portfolio trades, capital risk management
Beware of analysts motives
Emotions & Opinions
FOMO : bad timing
Lack of planning & discipline
Forgetting restraint
Obdurate repetitive errors, no adaptation
7 Important tools:
Trading View app!, Brokerage UI
Accurate indicators & settings
Wide screen monitor/s
Trading log (pencil & graph paper)
Big organized desk
Reading books, playing chess
Sorted watch-list
Checkout my indicators:
Fibonacci VIP - volume
Fibonacci MA7 - price
pi RSI - trend momentum
TTC - trend channel
AlertiT - notification
www.tradingview.com

value trapThis thing is ready for a precipitous descend. They keep pumping it on national television because of it's valuation, the 20 year mega-longs trying to squeeze every last dime out of it. This new semiconductor shortage & bandwagon 'foundry' talk is bullshit... coming online when I finally retire. But what are they doing in 6 months? Nothing. Apple pulled the plug, I'm punching up this thesis on an M1 MacBook that I haven't charged in days because this Apple chip is sooo damn fast & efficient, I wonder why anyone would want anything Intel has to offer.
No position yet, thinking about rolling into some long dated puts for October. Typical declines in INTC last 200 to 230 days on the weekly/5 yr charts. But I'll likely find some weeklies and continue rolling them out as this turd continues to lose market share amidst a rolling summer correction.
INTC share performance hasn't done jack for awhile. see-saw dead money. Quickly becoming deader money if the indices roll over...
INTC. Bullish Pullback setup. Some bearish signs to look for.Nobody ever knows what a stock is going to do, unless they are really way at the top and manipulating the market like a sissy would do.
-----
This is a bullish pullback, and I've included some bearish price action elements I'm looking out for that give me pause before pressing any buttons.

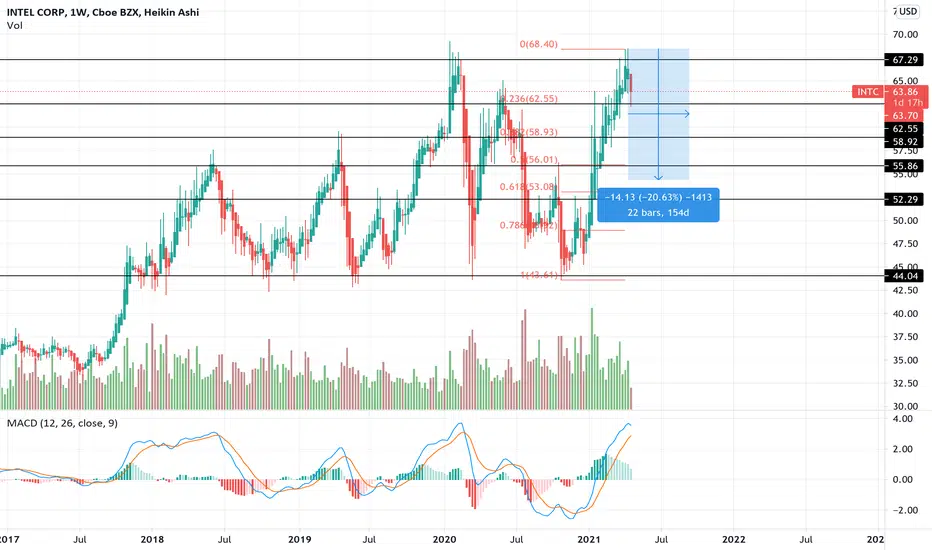
$INTC in correction modeThe bottom trendline of an ending diagonal has been broken, and we could have started a short-term correction.
It´s still too early to call correction targets, but ideally I´d like to see a pullback to the mid-50s (fibonacci levels, beginning of the diagonal).
After we see a clearer "signature" of the correction, I´ll post an update.


Bullish on INTC(This is not financial advice)
Hey everyone the market is very weird right now in that you can get a sense that nobody really knows what they want or how they feel. But there are still stocks that we can be confident in and in this case I feel that it is a facts over feelings situation. that we need to keep in mind.
Intel has a few bullish signals over the next few weeks and days. Intel is a big chip supplier and supporter for Apple which is releasing multiple new products on April 20th which should be great for the stock. This combined with the conference that Intel is having about new chips and AI technology should be great for the company and stock. Intel is also reporting earnings this week which should be bullish news as well.
The TA for this stock is also a good look. It has been on a good uptrend for multiple days and after bouncing off this support we are looking for a 10% gain. We are also looking for a buy signal on the MACD which would confirm this breakout.
Overall I am bullish on this stock over this coming week and if you agree with me or have other opinions on the stock let me know in the comments. Be sure to leave a like and follow if you like my ideas.
Thank you!
- Vlaire

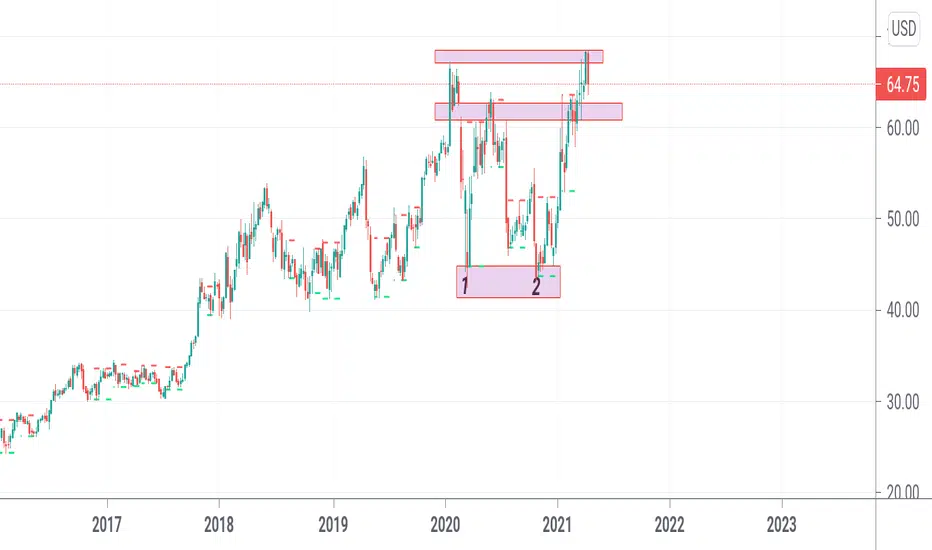
Breakout or Breakdown eminent?For the past year Intel has taken a beaten. This started when Intel announce they will not be delivering the new smaller nano meter chip. Subsequently after that earnings report the stock dumped 20 %. Since then the stock has trickled lower with a few up ticks creating lower lows. Over the past few months it has a created a descending triangle, which coincidentally matches the long term trendline. I think the stock is reaching a point where it may break out further, or completely breakdown. Possible plays include a strangle or straddle to capture any big swings. The fundamental side will indicate to take a short position in part due to the strong demand for AMD chips, and with the increasing trend of major companies, such as Microsoft and Apple manufacturing their own processors.

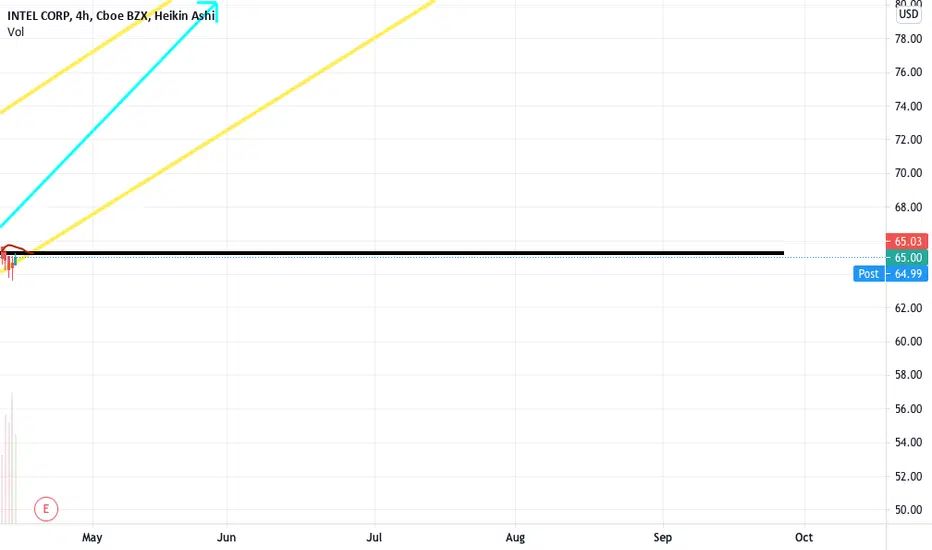
TM Is A HUGEEE Day For INTCINTC has tested the yellow support line at $64 and is coming up now to test the black resistance line. Could see some big moves out of INTC TM and going into the next trading week.


INTCINTC looking to complete next push, my PT is around 68-69$. MACD following its previous trends, looking for a nice push up in the next week or two.

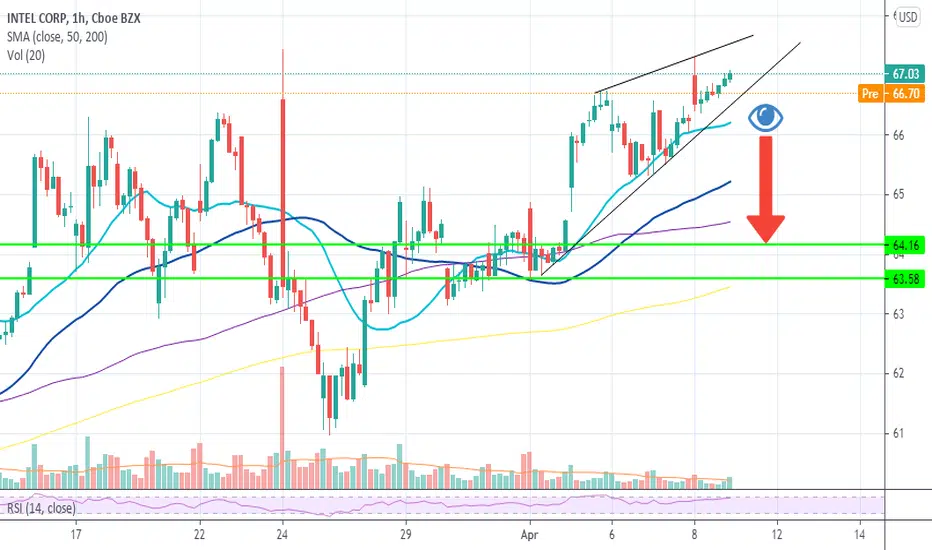
Looking to bearishly breakout of a Rising WedgeThis is an update to a previous chart of intel where i took 10 months of price action and called a diamond bottom. Now in this new edition i am adding a Rising Wedge along with the bearish crossing of the MACD. Will price action continue to so smoothly follow the rules of the patterns on Intel? We Shall see..
I believe that a reasonable target for a breakdown of the wedge will be towards the 200 SMA and EMA at Around 54 dollars or so.

My entry and exit for IntelIntel has a new CEO, and I'm very excited for their future. Unfortunately, Intel is in double-top territory, so I'm comfortable with waiting.