LLY Potential buy setupReasons for bullish bias:
- Entry is at breakout of HH
- DOW theory, SL at last HL
- Respecting trendline
Entry Level: 655.60
Stop Loss Level: 565.08
Take Profit Level 1: 746.12
LLYCL trade ideas

Eli Lilly's Alzheimer's drug Kisunla wins FDA approvalEli Lilly & Co.'s new Alzheimer's disease drug, Kisunla, has received approval from the US Food and Drug Administration (FDA), marking a significant advancement in treating the disease. This approval positions Kisunla as the second drug available that can slow the progression of Alzheimer's, a condition affecting around 6 million Americans.
Kisunla's journey to market has been fraught with regulatory hurdles, including the FDA's initial reluctance to fast-track the drug based on early trial results, preferring instead to review late-stage data. This thorough scrutiny culminated in a one-day hearing earlier this year to deliberate on Kisunla's safety and efficacy, eventually leading to its approval. Kisunla will now compete with Eisai Co.'s Leqembi, which has been available in the US since early 2023.
Technical analysis of Eli Lilly & Co. (NYSE: LLY)
Exploring potential trading opportunities, let us review the technical aspects of Eli Lilly's stock:
Timeframe: Daily (D1)
Current trend: there is an observable uptrend, though the stock has recently broken the support level at 905.00 USD and is attempting to consolidate below it
Resistance level: 917.00 USD
New support level: after breaking 905.00 USD, further confirmation is necessary to establish new support
Potential downtrend target: if a downtrend is established, the downside target could be around 820.00 USD
Short-term target: if the uptrend resumes and the stock price breaks through the resistance at 917.00 USD, a short-term target could be set at 940.00 USD
Medium-term target: should the upward momentum be sustained, the price might rise to 960.00 USD
Investors should closely monitor Eli Lilly’s performance, especially in light of the recent FDA approval of Kisunla. This development could significantly impact the company's market position and stock performance in the pharmaceutical sector.
—
Ideas and other content presented on this page should not be considered as guidance for trading or an investment advice. RoboMarkets bears no responsibility for trading results based on trading opinions described in these analytical reviews.
The material presented and the information contained herein is for information purposes only and in no way should be considered as the provision of investment advice for the purposes of Investment Firms Law L. 87(I)/2017 of the Republic of Cyprus or any other form of personal advice or recommendation, which relates to certain types of transactions with certain types of financial instruments.
Risk Warning: CFDs are complex instruments and come with a high risk of losing money rapidly due to leverage. 69.88% of retail investor accounts lose money when trading CFDs with this provider. You should consider whether you understand how CFDs work and whether you can afford to take the high risk of losing your money.

ELI LILLY Entering consolidation phase. Wait for the buy signal.Last time we looked at Eli Lilly (LLY) was on March 18 (see chart below) and we got the most out of it as we entered after a 1D MA50 correction and got the most optimal value:
Our original target was $1050 calculated according to the % rise of each previous Bullish Leg (+45%) of the +1 year Channel Up but now it appears that the stock won't hit that level during this Leg as we are entering the bottom phase of the Sine Wave.
As you can see on the chart (now on the 1W time-frame), this is where LLY typically pulls-back and consolidates (red Rectangle) until the next Bullish Leg begins near the 1D MA100 (red trend-line).
As a result, we are closing our bottom buy position and turn neutral on LLY until we approach the 1D MA100 again, starting mid-August.
-------------------------------------------------------------------------------
** Please LIKE 👍, FOLLOW ✅, SHARE 🙌 and COMMENT ✍ if you enjoy this idea! Also share your ideas and charts in the comments section below! This is best way to keep it relevant, support us, keep the content here free and allow the idea to reach as many people as possible. **
-------------------------------------------------------------------------------
💸💸💸💸💸💸
👇 👇 👇 👇 👇 👇

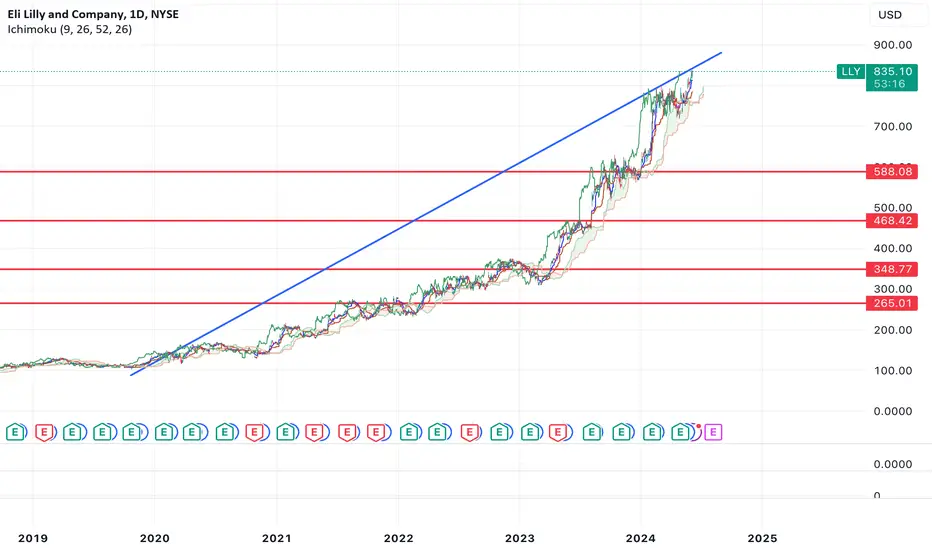
$LLY look out below $265 bottom coming soonNYSE:LLY looks like it's topping up here. Anytime you see a chart that has gone straight up like this, you know the fall is going to be painful.
I think we'll top within the next week or two and then we're going to start the bear market that goes all the way down to $265 before it truly bounces.
Why do I think this? If you create a parabola, price is starting to break through it which means we're likely to see a 80%+ correction once the trend changes.
On top of this, RSI is in extreme overbought territory.
If you're long, I'd set stops where you're comfortable with gains because once this move down happens, months worth of gains will evaporate.
Have been bearish for a whileIt hasn't started its journey south as of yet. Every good stock can go long periods without a retrace, but the bottom line is it's coming at some point, and when it does, lower to mid 800 is where I have it targeted
LLY Eli Lilly Options Ahead of EarningsIf you haven`t bought the 6.20X call:
nor the 4.10X gain:
Then analyzing the options chain and the chart patterns of LLY Eli Lilly prior to the earnings report this week,
I would consider purchasing the 860usd strike price Calls with
an expiration date of 2024-7-19,
for a premium of approximately $9.20.
If these options prove to be profitable prior to the earnings release, I would sell at least half of them.

I would short thisI know indicators can change in an instant. But this one is ready to reverse by finding its feet again; things have gotten a little crowded up there, but it's only a matter of time before we see 828 or around.

$LLY next $1T company?🚀 Eli Lilly’s weight-loss drug tirzepatide has taken the world by storm! After its success, CEO Dave Ricks is accelerating the development of even more powerful obesity treatments. Stay tuned for more breakthroughs! 🌟

lly good phase 2, but still overboughtEverything is screaming to allow room to breathe. Now is the time to correct to the low 800s—or soon enough. There is not much further to go!

$LLY putting bullish case for $870NYSE:LLY has been capturing obesity market with monstrous growth. Currently it's entering the volume gap. RSI and William% range now showing bullish divergence. My pt is $870.

LLY -- Does the BBTrend indicator really work?LLY has been a very strong stock over the past year -- obviously.
But when the new BBTrend indicator is viewed, does it work or is it BS?
My opinion is that it is BS. The only indicated substantial downtrend immediately follows an earnings Gap Up. In the several days following the gap, nothing trends downward.
Now look at the major uptrend (by BBTrend indicator) in March and April this year. I'd call it a non-trending flat period. When the BBTrend indicator is barely positive, in May and June, is the strongest uptrend of the chart.
So is BBTrend working or is it just BS? What is your experience with this new indicator?

Riding the Wave or Reaching the Crest?Recent news highlights that the Lilly Endowment sold over $150 million worth of shares. While significant insider selling could be seen as a bearish signal, it’s important to note that this does not necessarily reflect the operational performance or future outlook of the company. Investors should consider both the strategic aspects of such sales and the broader market context.
The earnings report due in 59 days is critical. With strong performance in recent quarters and a solid revenue forecast, any positive surprises could further fuel the stock’s ascent.
Short-Term Outlook:
Price Target: Based on the current momentum and technical indicators, a short-term price target is set at $870, contingent upon breaking the $856.05 resistance level.
Trading Strategy: For traders looking to capitalize on this trend, consider going long at the current levels with a stop loss placed just below the 10-day EMA at $785 to mitigate downside risk. If the price breaches $856.05 with strong volume, an aggressive target towards $900 could be pursued.
Long-Term Outlook:
Price Target: Given the bullish indicators and historical performance, a longer-term target of $920 is speculative yet achievable if the bullish trend sustains post-earnings.
Trading Strategy: Long-term investors might consider maintaining their positions while setting a trailing stop loss to protect gains against potential market volatility or a sectoral pullback.
Shorting Strategy:
When to Short: If RSI and Stochastic levels remain in the overbought zone and price action fails to break above the resistance at $856.05, short positions could be considered.
Stop Loss and Targets: Set an initial stop loss at $870 to cover the short in case of a breakout. A potential target for the short could be around the $820-$800 range, aligning with recent support levels.
Eli Lilly & Company showcases a compelling bullish case with robust technical support. However, the overbought conditions and strategic insider selling warrant cautious optimism. Investors should closely monitor the upcoming earnings report and market reactions to pivot their strategies accordingly. The current analysis suggests a primary bullish bias with well-defined entry and exit points to optimize risk-reward dynamics in the volatile pharmaceutical sector.

BUY LLYInvesting differs from trading as it focuses on long-term growth and sustainability of assets rather than quick gains. An investment idea involves committing money to ventures, projects, or assets expected to grow in value over time, such as stocks, bonds, or real estate.
Investing requires understanding the fundamental factors that drive growth and stability. It involves detailed analysis of opportunities, like evaluating a company's financial health and potential for innovation, to minimize risk and maximize long-term gains.

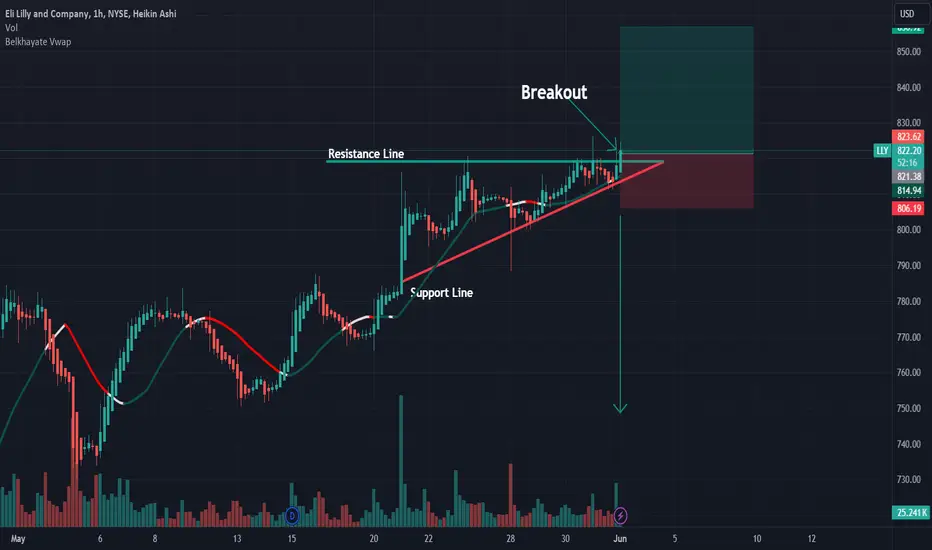
LLY: Buy ideaBuy idea on LLY as you see on the chart because we have the breakout of the resistance line by a big green candle follow by a large green volume.!
ELI LILLY Preparing for the final buy opportunity.Eli Lilly is on a very steady bullish technical outlook on the 1D timeframe (RSI = 62.145, MACD = 9.380, ADX = 18.580) as it has been trading inside a Channel Up since January 2023. The current bullish vessel within this pattern is a Rising Wedge. As you can see, the two Wedges prior have a last break under the 1D MA50 before rallying to a HH at the top of the Channel Up. The 1D RSI has already crossed over its LH trendline so every pullback that comes in the next 2 weeks, is in our opinion the last buy opportunity. Our target is approximatelly a +45% rise (TP = 1000) which is the rise that all bullish structures prior experienced.
See how our prior idea has worked out:
## If you like our free content follow our profile to get more daily ideas. ##
## Comments and likes are greatly appreciated. ##

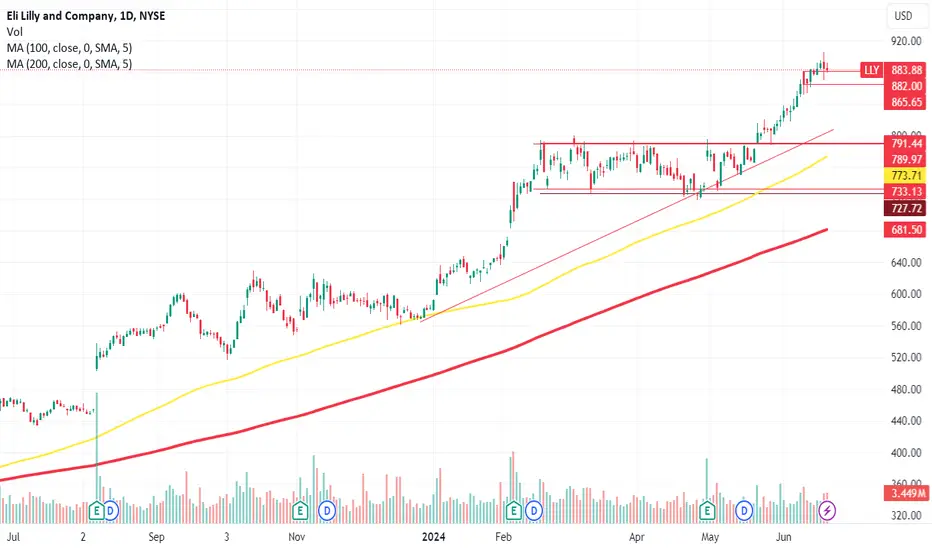
LLY - watch the behavior above $800Round numbers have psychological importance to market participants. They often initially act as a barrier. Once cleared they can become support or... a distant location in the rearview mirror. For reference, notice LLY's consolidation below 600 and how it took off after clearing it.
A full candle close above 800 implies continuation. The next area of interest for me is the $830 0.786 of the fib extension from the February to March move. Getting above that will make things interesting. Note that the fib time zones have been moderately predictive, but that trend has respected fib fan pretty tightly. Simply remaining within the current channel is a strong opportunity.
This is my largest position and a long-term hold. Invalidation of the current uptrend. It would take a move below ~752 to have me looking at a secondary downtrend, and a move below 720 to have me taking funds off of the table. If playing the break above this level on a shorter time frame, I'd keep a stop as tight as ~783.

Bull flag formation has been identified. Upwards now 👊Price looks primed for for upside.
Bull flag formation has been identified with our flag mapped out upside target.
Bullish crossover of the Stochastic RSI.
RSI also trending upwards.
All roads indicate that bulls are priming it for more upside?
Are you long or short now?

Eli Lilly's Stock Surges 4.77% on Weight-Loss Wonder DrugEli Lilly & Company (NYSE: NYSE:LLY ) has sent shockwaves through the pharmaceutical industry with the meteoric success of its weight-loss drug Zepbound, propelling the company's stock to new heights despite a mixed first-quarter performance. With sales of Zepbound surpassing Wall Street's projections by a staggering margin, Eli Lilly has raised its sales outlook for the year, overshadowing slight revenue dips from other key products.
Zepbound's Triumph and Guidance Boost:
In a remarkable turn of events, Zepbound emerged as the star performer in Eli Lilly's ( NYSE:LLY ) portfolio, surpassing sales forecasts by a substantial margin. With first-quarter sales reaching $517.4 million, well above the expected $373 million, Zepbound's success has prompted Eli Lilly to raise its sales guidance for the year by a staggering $2 billion. This unexpected surge in demand for the weight-loss drug has underscored Eli Lilly's position as a frontrunner in the pharmaceutical industry and has reignited investor confidence in the company's growth prospects.
Challenges and Opportunities in the Diabetes Market:
While Zepbound's success has captured headlines, Eli Lilly ( NYSE:LLY ) faces challenges in its diabetes portfolio, particularly with drugs like Mounjaro and Trulicity. Despite a surge in sales for Mounjaro, both drugs fell short of analyst expectations, highlighting the competitive landscape in the diabetes market. However, with plans to expand production significantly in the second half of the year, Eli Lilly remains optimistic about its ability to meet the growing demand for diabetes treatments and capitalize on emerging opportunities in the market.
Analyst Insights and Market Response:
Analysts have offered mixed assessments of Eli Lilly's performance, with some highlighting the company's robust guidance raise and the continued strength of Zepbound, while others have raised concerns about softer sales in the GLP-1 franchise. However, overall sentiment remains positive, with analysts reaffirming their bullish outlook on Eli Lilly's stock and emphasizing the company's strategic initiatives to drive growth and innovation.
Looking Ahead:
As Eli Lilly ( NYSE:LLY ) charts its course forward, all eyes are on the continued success of Zepbound and the company's ability to navigate challenges in the diabetes market. With a bolstered sales outlook and a commitment to expanding production capacity, Eli Lilly ( NYSE:LLY ) is poised to capitalize on evolving consumer preferences and emerging opportunities in the pharmaceutical landscape.

NYSE > short > LLY Based on my graphic analysis I observe a bearish projection reaching minus 7,5% in the price of this corporation, that is; from $733 it will drop to $678. With a buy exit emerging at $777, it is worth remembering that the exact time the decline will take is unpredictable, the market will simply do its job. We can mention that it will happen within the next 15-20 days from this post!
REFERENCES:
* Green line: emergency exit price: $777 = -6%
* Red line: selling price (position) $733
* White line: profit $678 = +7,5%
However, it is important to remember that these marked lines must be respected. If the price goes up 2 to 3% after you execute the position, don't try to improvise and change everything. The movement could return to the initial direction and you will be left frustrated!
"Sitting quietly and waiting for the operation to develop most of the time will allow you to earn much more money. That is, sit in the stands and enjoy the spectacle that the bull will present to you, control your emotions, since the biggest enemy of "The time to invest is yourself"
As for capital management, I leave it to my personal discretion knowing that we must always have money flowing and remain firm in the market.
Greetings and I hope you take advantage of this good negotiation opportunity!
> Josias Baltazar.n

LLY, LILLY IS THIS STOCK PRICE SILLY?I hope you appreciated my rhyme.
So what to say about this.
One main trend line at the moment.
Big support incoming at 580 to 560 range.
Really big support at 108.
The lines in the middle (light green and red) are fairly weak and more likely short term targets.
I assume the long term targets will line up well with the gaps which are marked in orange.
Orange also on RSI, which is saying be careful.
Short term can take it up to 980 or so but I think the lower targets are more likely and we'll see the higher targets after trend breaks and before it starts to really drop.
However, there are a lot of possibilities that can occur.
The main possibility looks to be a chance of a move to 980, but more likely won't get there and might stick around 780.
I really have a hard time saying what this will do and when it will top out, I could tell you more if I watched this daily, but I don't.
This chart is long term price targets for the downside and the upside.
Given the single trend, you'll need a new chart as more develop, feel free to message if I haven't updated after some time.
I think that covers most everything.
Summary.
I think this stock is overvalued big time, but still has potential to keep seeing more upside in the short and mid term.

Eli Lilly and Company (LLY) - Technical Analysis ReportEli Lilly and Company (LLY) witnessed a marginal increase in its last session, closing at $762.91, which is a 0.75% uptick from the prior close. This movement is within a tight consolidation range, hinting at indecision in the market after a notable uptrend.
Volume and Momentum Indicators:
The volume of 842.624K is aligned with the average, suggesting a normal activity level without significant pressure. The On-Balance Volume (OBV) stands at 1.692B, supporting the current price level with stable demand.
Oscillators:
Relative Strength Index (RSI): The RSI is at a neutral stance of 49.85, giving room for potential price swings in either direction without immediate overbought or oversold concerns.
Moving Average Convergence Divergence (MACD): The MACD line is under the signal line with declining histograms, implying a potential bearish crossover and a slow-down in bullish momentum.
Technical Patterns and Indicators:
Moving Averages:
Ichimoku Cloud: LLY's price action remains above the cloud, indicative of a bullish primary trend. The recent price moves close to the cloud top may signal the need for cautious bullish optimism.
Fibonacci Retracement:
The Auto Fibonacci Retracement tool suggests key support at the 0.618 level ($727.85). The current stabilization near the 0.236 level ($762.91) may serve as a pivot for the next price movement.
Speculative Price Targets:
A bullish scenario could see LLY attempting to break the resistance near the recent highs at around $780. Clearing this level may pave the way towards an optimistic target of $800, a psychological and round number resistance.
Conversely, a bearish shift could lead to a retest of the $727.85 support level, aligning with the 0.618 Fibonacci retracement. A break below could see further downside towards the robust support at $700, a key psychological threshold.
Conclusion:
Eli Lilly and Company is exhibiting signs of consolidation with the potential to break in either direction. The neutral RSI and bearish hint from the MACD suggest that traders should be prepared for increased volatility. The proximity to the Ichimoku cloud top also adds to the necessity for vigilance. Holding above or a bounce from the Fibonacci levels could signal strength, whereas a close below could indicate a deeper retracement.

LLY Consolidation at ATH - Breakout Incoming?LLY is looking really good here on the daily chart. It's been consolidating just below ATH on declining volume. It's been respecting the 20 EMA nicely, and MACD is about to flip bullish. definitely one to watch for a breakout.

LLY shorttrendline break + retest.
Possible Head & Shoulders
assumption: Fib# Ext. to 2.618 ( 800 ), retracement to 1.618 (690)
Short 780
Stop 801
Target 690, 650
Risk management is much more important than a good entry point.
I am not a PRO trader.
In my trading plan, the Max Risk of each short term trade should be less than 1% of an account.
