MRK 4HR Chart: Gap up set up huge News!Was very excited to chart this one as I trade strictly via mobile with TOS Mobile Trader.
What you notice in each outline rectangle is one of my fav setups in which is labeled "CANDLE COMBO"
Definition: Candle Combo-
Basic bullish candle formation that signals more upside. In which the stock usually continues from closing price or initially gaps up. These combos usually occur right below or at middle kelt or upper kelt
MRK still has one more gap to fill thats labeled 65.50. If the stock does gap we should retest 65.25 then 65.29 followed by the fill at 65.50.
With this fda fast track news which is HUGE we just might fill the gap.
-TheTradingNinja
MRK trade ideas

MRK Long $65.5 BreakWent long $65C before the test and break of $64.50 which broke on strong volume with a push to 64.59HOD.
Also there was huge call sweep in June 55 and 56Calls
Usually means News, Upgrades etc on the bullish upside!
-TheTradingNinja

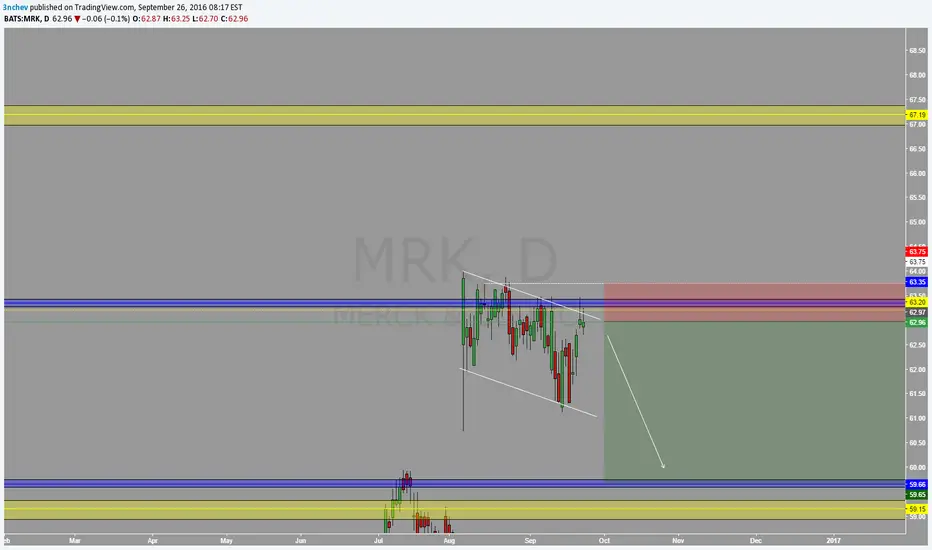
$MRK bullish after Earning Report, today close 63.63 stop 61.5MERK Bullish after Earning Report, today close 63.63 stop 61.5

Strangle on MRK for a neutral tradeAfter earnings, Implied volatility rank is still at 50 so looking to add premium to my portfolio theta I Sold the 65/62.5 Strangle on MRK.
Trade:
Short 65 Call
Short 62.5 Put
Collected $1.85
54% probability of profit
Will look to close at 50% of credit received.


Bullish Moving Average Cross For MerckOn April 19, 2017, Merck & Co ( NYSE:MRK ) crossed above its 150 daily moving average (DMA). Historically this has occurred 227 times and the stock does not always move up. It has a median gain of 4.139% and maximum gain of 18.194% over the next 16 trading days.
When we take a look at other technical indicators, the relative strength index (RSI) is at 40.4843. RSI tends to determine trends, overbought and oversold levels as well as likelihood of price swings. I personally use anything above 75 as overbought and anything under 25 as oversold. The current reading declares the stock is relatively neutral.
The true strength index (TSI) is currently -18.4921. The TSI determines overbought/oversold levels and/or current trend. I solely use this as an indicator of trend as overbought and oversold levels vary. The TSI is double smoothed in its calculation and is a great indicator of upward and downward movement. The current reading declares the stock is moving down, but the decline is slowing making a potential reversal to the upside possible.
The positive vortex indicator (VI) is at 0.7725 while the negative is at 1.1322. When the positive level is higher than 1 and higher than the negative indicator, the overall price action is moving upward. When the negative level is higher than 1 and higher than the positive indicator, the overall price action is moving downward. The current reading declares the stock is moving down.
The stochastic oscillator K value is 24.0888 and D value is 25.7547. This is a cyclical oscillator that is highly accurate and can be used to identify overbought/oversold levels as well as pending reversals and short-term activity. I personally use anything above 80 as overbought and below 20 as oversold. When the K value is higher than the D value, the price action is trending up. When the D value is higher that the K value, price action is trending down. The current reading declares the stock is on the verge is moving up and away from oversold territory.
Considering the moving average crossover, RSI, TSI, VI and stochastic levels, the overall direction appears to continue heading up. Based on historical movement compared to current levels and the current position in its macro trend channel, the stock could gain at least 2.12% over the next 16 trading days.
On April 18, the stock crossed below the 150 DMA. In the last 10 years when the stock is above the 150 DMA, crosses under for one day before re-crossing above, the stock has always gone up over the next 16 trading days. These occurrences were in July 2009, April 2010, November 2011 (3 times), June 2012, March 2013, February 2015, and January 2017. The stock gained 15.911%, 0.971%, 5.072%, 5.531%, 2.517%, 9.091%, 7.659%, 1.134%, and 5.080% respectively. The median gain was 5.080% during this period.


Merck & Co Inc on Possible Wave Y Completion?It seems that we may have a possible Wave Y completion on the Intermediate Period, with a wave 5 on the Minor Period confirming it. On structure breakout, it is possible that we may see the start of a SHORT on a wave 1 minor of a wave 1 Intermediate. MACD suggests slight upwards movement before a bearish move at the breakout of structure. Stochastic already displays overbought position and likely move downwards as well as RSI suggests overbought position already completed and bearish movement possibly imminent on breakout of structure. Additionally, my guess is that due to looming lawsuits regarding Vaccine safety as well as gender bias lawsuits, has ultimately influenced investor confidence and is now starting to net the results of this.
----------------------------------------------------------------------------------------------------------------------------------------------------------
DISCLAIMER: This chart is for sharing and educational purposes only and is not intended to be a signal service or similar.
This chart analysis is only provided as my own opinion, based on my own analysis and comes with absolutely no warranty that this analysis is correct, whatsoever. Do not trade this chart if you do not have your own strategy. Trade only with your own strategy at your own risk.
Plan your trade and trade your plan... and IF in doubt, stay out.
.....::::: If you like this chart, please click on the THUMBS UP ! :::::.....
----------------------------------------------------------------------------------------------------------------------------------------------------------

MRK - strong return to previous rangeHey guys, nice opportunity for swing trade!
More info in the screen.

MRK ...WEEKLY REVIEW it was my suggestion 6 days ago and i am emphasis on it ...
in my idea it has no strong resistance to receiving to TP ...
im in and if you are not think to entry

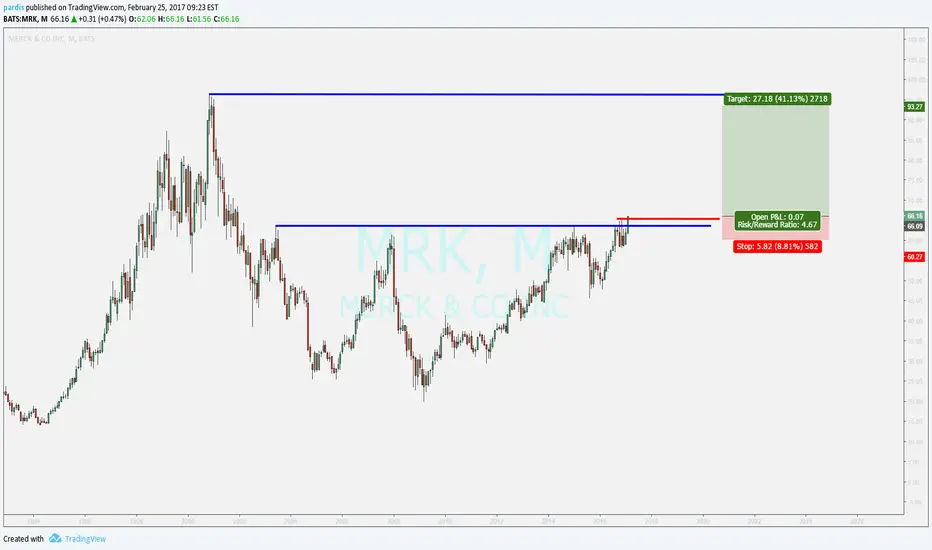
MRK...monthly view ...buynice uptrend ...
passing of a important price level (blue line )...
triggered ....buy
MRK @ daily @ highest H/L-Range (dow shares) while 2017This is only a trading capability - no recommendation !!!
Buying/Selling or even only watching is always your own responsibility ...
.zip (with PDF`s) @ my Google Drive
drive.google.com
4XSetUps for next week - friday close (DOW 30 Index & all shares)
Best regards :)
Aaron

MRK @ daily @ BreakedUp mostly (30 dow shares) while last weekThis is only a trading capability - no recommendation !!!
Buying/Selling or even only watching is always your own responsibility ...
.zip (with PDF`s) @ my Google Drive
Break Downs (Dow Jones Index incl. all shares)
drive.google.com
Best regards :)
Aaron


Channel + Doji + Exhaustion GapEntered MRK with Feb17 60 Calls. Buy Low sell high. Playing what looks to be an exhaustion gap doji at the bottom of a channel
Trigger: 1.30
Stop: .85
Target: 2.92
R:R: 3:1
I expect a bounce or a gap up in next couple days. If it does not come I will look to exit aggressively because these setups usually work fast if identified correctly.


MRK... one more advance Multiple reasons making MRK is so attractive to buy stock or option calls. Elliott wave count show that iv wave in undergo and not yet overlapped with wave i. Other reason is the price puased at 38% fibo. Third reason the EMA 70 is hold price from falling. I am in in call option and when wave iv overlapped with wave i I will sell my position. Remember I am short-term trading. Good luck

Favorite MerckStill in bullish trend , no shorts before break of trendline and hold below with bearish rejections of Highs.

