MRK trade ideas


MRK is bouncing of the trend line.Long time trend line is supported, and MACD divergence in play. Trade with care as the stock closely correlates with DOW and SPX500. They are both pointing south though.

Dogs of the DOW - One Year Entrance – MRKThe current Dogs are: CVX, CAT, VZ, PFE, CSCO, IBM, BA, MRK, INTC, XOM. Take a look at each one of those names on a DAILY CHART. Set only ONE Exponential moving average on the chart. Just one. Nothing else. A 33 Exponential Moving Average, offset by 3. As soon as you get a Daily Close of any of those stocks, above that 33 Exponential moving average, buy the stock, and hold it for the year, up to February 24th, 2017. That's it, that's the entire strategy.
Once bought, FORGET THE EMA's, as the link to the article that explains the strategy points out. CVX is waiting. CAT IS A BUY. VZ is a buy. PFE is one to wait for. CSCO, you buy. IBM is a buy. BA is one to wait for. MRK is one to wait for.


DOW JONES OVERVIEW: MRK IN MACRO UNCERTAINTY, ON MICRO RISKMerck fell into uncertainty on long term basis, but is on risk to fall on short term perspective.
On long term perspective price is now in lateral range after it failed 10-year uptrend, by falling below 1st standard deviation from 10-year mean @ 54.65 (now the range upper border). The lower border of the macro lateral range is marked by 5-year mean, standing now at 46.50 - MRK has tested and held this level during the august selloff.
On short term basis price is now trading below 1st standard deviations from 1-year and quarterly means, which are aligned with the 1st standard deviation from 10-year mean. It means that as long as price is below 54.65, there is ongoing risk of further decline and retest of the 5-year mean!

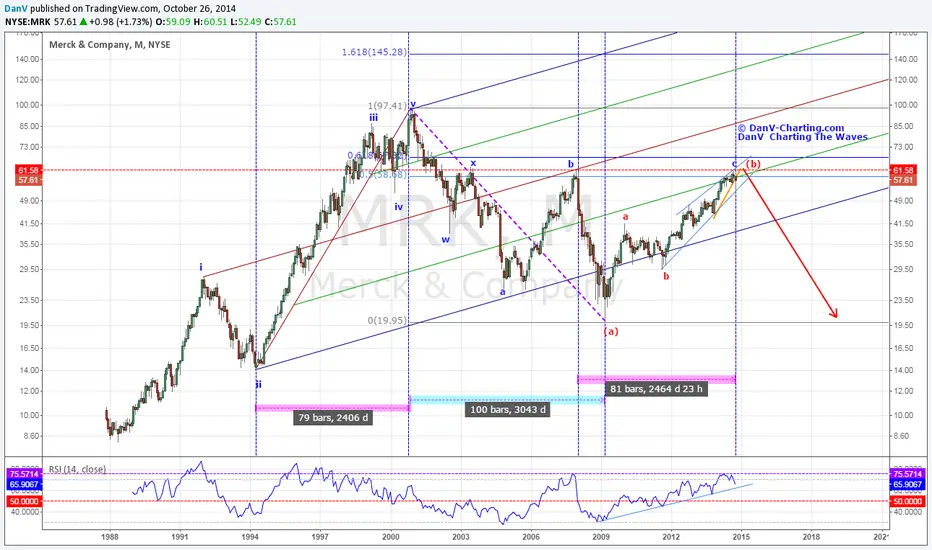
Merck - Could the future get any murkier for Merck?Merck & Co has been in Bearish Cycle since the major top in 2000. Since when it appear to have completed (a) and (b) of the abc zigzag. Coincidently also we have potential double top in the making. If correct then future for the investors in Merck & Co will get even more murkier and painful as potentially we could have impulsive leg c of the abc unfolding.
Not sure what the earnings number will be release tomorrow, though it is unlikely to bring any sustained pain relief.
This would particularly be the case if the wider equity market also experience anticipated weakness.
As always be sure to do your own analysis. If you like my analysis select to follow me if you haven't already and select to follow the charts for any updated and share is with your trading circle.
MRK Tight Consolidation Break - Long/Short (SAR)As I point out in the chart, MRK is in a very tight consolidation here. With the RSI holding inside of bullish territory after it's recent bounce off the 150EMA it has run into previous resistance. This resistance coincides with a sort of ascending triangle based on the higher-lows it has been making since March '14. This pattern comes to us after a long run up from Nov '13, leading me to have a bias for this play to the upside.
The goal here is to watch it intraday and get long one tick above the most recent bar high ($59.37). Alternatively, we will get short intraday at one tick below the most recent bar low ($58.89) and holding it short expecting a bounce off of the resistance.
The idea is to SAR (Stop & Reverse) the position on a close one tick above/below the same high/low, depending on how we entered.
This means we have $0.77 cents of risk either direction. With a target on the downside around $56.30 and to the upside $64.75 by conservative estimates, that gives us a favorable risk reward. All said and done, the thinking here is that with this tight consolidation at a key level, a big decision will be made here in the coming days, that will make a big play for us. What happens after these candles could be the deciding factor, and we may even see a candle that reinforces one direction over the other to help us in our decision.

MERCK - MRK IN 1999-2000 PEAKED AT 13-14 PSR (price to sales)EDUCATIONAL CHART: HISTORICAL REFERENCE
EUPHORIA is anything more than 10 times sales = you'll see it in Drug Stocks, Consumer Brands, Internet Names, Technology (Semiconductors, etc): I've seen it several times since the 1980's. This just goes to show you what can happen AFTER these extreme valuations - a drop of 70%-90%.
I'll publish another chart in MICRON TECHNOLOGY (MU) and show you the same pattern.
This is EUPHORIA FOLKS - this is what it looks like.
This is exactly what we have in many stocks now across the board in the markets

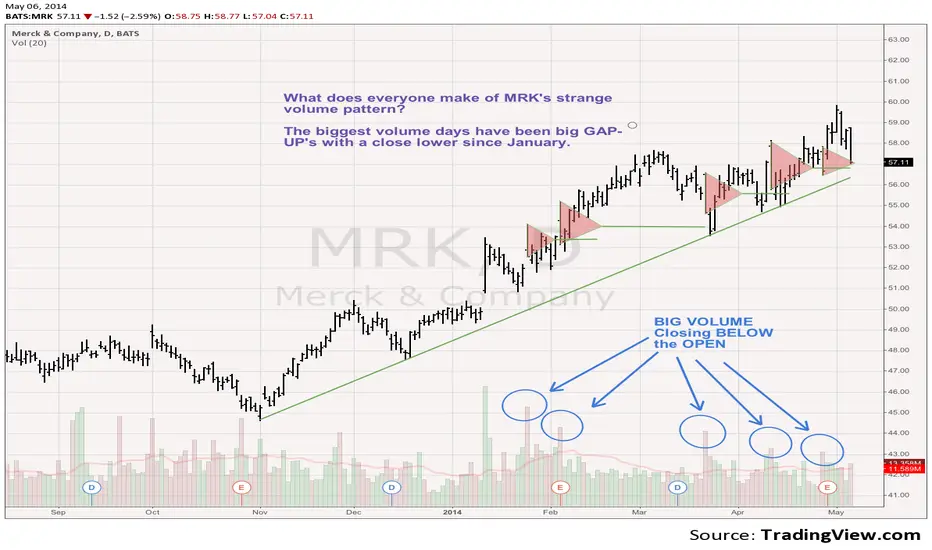
Merck MRK daily has 5 monster volume days where gap UP's then...What do you make of this pattern of volume in Merck MRK here on the daily chart?
Each time this has happened since January it has moved higher, but I think it is distribution by a massive seller, akin to the days of Jesse Livermore. It is so unusual that I'd have to say in my nearly 30 years of watching charts that I haven't seen a chart look like this before. If MRK can break under one of these support lines, then it could mark the end of this uptrend. Granted I don't see tremendous downside risk, perhaps 10% or so.
Strategy: Sell short going under 57 with a 59 stop. Target initially 54-53.
Tim 4:16PM EST, May 6, 2014 57.11 last -1.52
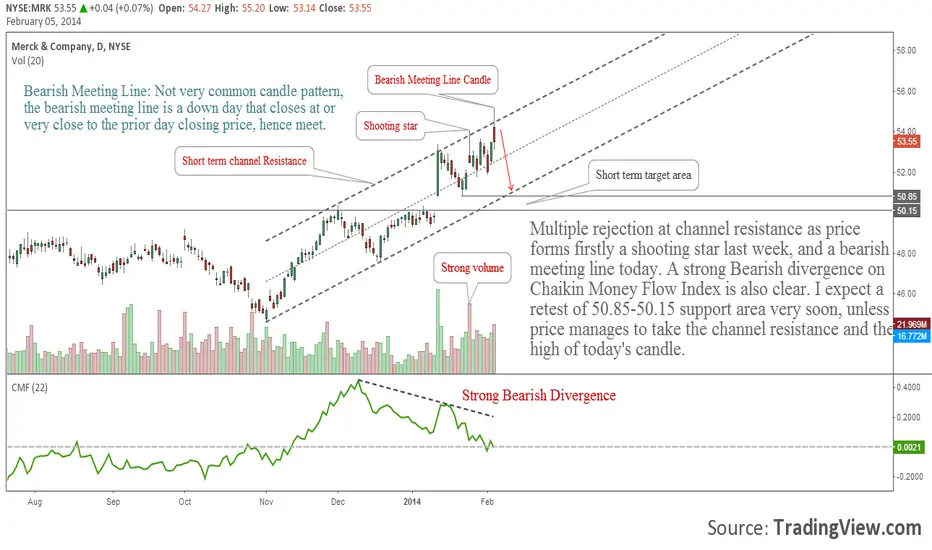
Merck & Co: Bearish Signals Multiple rejection at channel resistance as price forms firstly a shooting star last week, and a bearish meeting line today. A strong Bearish divergence on Chaikin Money Flow Index is also clear. I expect a retest of 50.85-50.15 support area very soon, unless price manages to take the channel resistance and the high of today's candle.
Bearish Meeting Line: Not very common candle pattern, the bearish meeting line is a down day that closes at or very close to the prior day closing price, hence meet.
Bull flag on MRKPretty basic formation. Remember to place the stop loss ,preferably below the spinning top which confirmed the breakout. Keep it simple :)

