MERCK Stock Chart Fibonacci Analysis 030623 1) Find a FIBO Slingshot
2) Check FIBO 61.80% level
3) Entry Point > 109/61.80%
MRKCL trade ideas


$MRK with a Bullish outlook following its earnings #Stocks The PEAD projected a Bullish outlook for $MRK after a Negative Under reaction following its earnings release placing the stock in drift D with an expected accuracy of 77.78%.

(MRK) - Price Targets & Stop Loss 📈 What’s up investors! 📉
Welcome back to another one of
💡“Mike’s Ideas”.💡
I post as I find signals… these signals are based on the personal rules I have built and follow in order to make up what I call the “SST Strategy”. Follow for more ideas in the future!!
I have 4 levels marked and colour coded on the Chart.
These levels are:
🔴 Red = Stop Loss
🟢 Green = 1.2:1 Risk Reward Ratio
🟡 Yellow = 1.5:1 Risk Reward Ratio
🔵 Blue = 2:1 Risk Reward Ratio
👀 So what are we looking at today…!!!
🚨(MRK) Merck & Co., Inc.🚨
Operates as a healthcare company worldwide. It operates through two segments, Pharmaceutical and Animal Health. The Pharmaceutical segment offers human health pharmaceutical products in the areas of oncology, hospital acute care, immunology, neuroscience, virology, cardiovascular, and diabetes, as well as vaccine products, such as preventive pediatric, adolescent, and adult vaccines. The Animal Health segment discovers, develops, manufactures, and markets veterinary pharmaceuticals, vaccines, and health management solutions and services, as well as digitally connected identification, traceability, and monitoring products. It serves drug wholesalers and retailers, hospitals, and government agencies; managed health care providers, such as health maintenance organizations, pharmacy benefit managers, and other institutions; and physicians and physician distributors, veterinarians, and animal producers. The company has collaborations with AstraZeneca PLC; Bayer AG; Eisai Co., Ltd.; Ridgeback Biotherapeutics; and Gilead Sciences, Inc. to jointly develop and commercialize long-acting treatments in HIV. Merck & Co., Inc. was founded in 1891 and is headquartered in Kenilworth, New Jersey.

MRK Divergences + Trendline breakMRK broke below its trendline with both a MACD and RSI Divergence. Volume profile doesn't look supportive at these prices. Healthcare names have been a safe hiding place through the recent sell off

MRK Bearish EngulfingNasty bearish engulfing candle larger than the previous 2 days. Had completed a 9count on 11/30, chopping around since, losing 108.6 volume shelf sends it down


MRK | Time for Puts | MerckMerck & Co., Inc. operates as a healthcare company worldwide. It operates through two segments, Pharmaceutical and Animal Health. The Pharmaceutical segment offers human health pharmaceutical products in the areas of oncology, hospital acute care, immunology, neuroscience, virology, cardiovascular, and diabetes, as well as vaccine products, such as preventive pediatric, adolescent, and adult vaccines. The Animal Health segment discovers, develops, manufactures, and markets veterinary pharmaceuticals, vaccines, and health management solutions and services, as well as digitally connected identification, traceability, and monitoring products. It serves drug wholesalers and retailers, hospitals, and government agencies; managed health care providers, such as health maintenance organizations, pharmacy benefit managers, and other institutions; and physicians and physician distributors, veterinarians, and animal producers. The company has collaborations with AstraZeneca PLC; Bayer AG; Eisai Co., Ltd.; Ridgeback Biotherapeutics; and Gilead Sciences, Inc. to jointly develop and commercialize long-acting treatments in HIV. Merck & Co., Inc. was founded in 1891 and is headquartered in Kenilworth, New Jersey.

TOP US-Stocks: Buy-Signal MRKThe stock just broke through a perfect buy point and triggered a buy-signal. The stop loss level and profit target are shown in the graphic.
All stocks on our watchlists meet the hard selection criteria according to Mark Minervini's Trend-Template and William o' Neil's CAN SLIM methodology AND
are in the process of developing a Perfect Buy Point and a low-risk entry, following a volatility contraction pattern.
The stock just broke through a perfect buy point and triggered a buy-signal. The stop loss level and profit target are shown in the graphic.
🍾🍾 We trade like the Champions 🍾🍾
Are you struggling with your trading strategy? Follow me to get free, real-time trading signals which are all based on Mark Minervini's success-proven strategy.

$MRK with a Bullish outlook following its earnings #Stocks The PEAD projected a Bullish outlook for $MRK after a Positive Under reaction following its earnings release placing the stock in drift A with an expected accuracy of 75%.

MRK | Short | 20 oct 2022I see some possible bearish movement on this stock. most probably MRK will fall for retest given level

Merck has Potential. MRKDivergent on the downside across multiple timeframes. Betting on a triangle B formation, now due for a C Wave to the upside. No confirmation yet. Speculating that this might be a very short term event.
We are not in the business of getting every prediction right, no one ever does and that is not the aim of the game. The Fibonacci targets are highlighted in purple with invalidation in red. Confirmation level, where relevant, is a pink dotted, finite line. Fibonacci goals, it is prudent to suggest, are nothing more than mere fractally evident and therefore statistically likely levels that the market will go to. Having said that, the market will always do what it wants and always has a mind of its own. Therefore, none of this is financial advice, so do your own research and rely only on your own analysis. Trading is a true one man sport. Good luck out there and stay safe.

Merck & Company Analyze💊!!!Merck & Co., Inc. is an American multinational pharmaceutical company headquartered in Rahway, New Jersey. It is named after the Merck family, which set up Merck Group in Germany in 1668. The company does business as Merck Sharp & Dohme outside the United States and Canada.
Merck was able to break the support lines. For now, it completed its pullback to support lines.
I expect that Merck will go down at least to the lower line of descending channel.
Merck & Company Analyze ( MRKUSD) Timeframe 4H⏰.
Do not forget to put Stop loss for your positions (For every position you want to open).
Please follow your strategy, this is just my idea, and I will be glad to see your ideas in this post.
Please do not forget the ✅' like '✅ button 🙏😊 & Share it with your friends; thanks, and Trade safe.

MRK $MRK Continuation ShortMRK $MRK Continuation Short. TP and SL on chart. Move SL on TP. After TP2, trail with 0.5ATR step and 1.5ATR offset.

MRK wave count EW 4 hourLooking for MRK to complete the 8 wave cycle, currently in the final C leg. Target looking for 50% retracement of the 1-5 wave.

Merck and Company slowing down? Merck and Company
Short Term
We look to Sell at 93.34 (stop at 96.33)
We look to sell rallies. Price action looks to be forming a top. Although the bulls are in control, the stalling positive momentum indicates a turnaround is possible. There is scope for mild buying at the open but gains should be limited.
Our profit targets will be 86.55 and 83.96
Resistance: 92.00 / 95.00 / 100.00
Support: 86.50 / 83.50 / 80.00
Disclaimer – Saxo Bank Group. Please be reminded – you alone are responsible for your trading – both gains and losses. There is a very high degree of risk involved in trading. The technical analysis, like any and all indicators, strategies, columns, articles and other features accessible on/though this site (including those from Signal Centre) are for informational purposes only and should not be construed as investment advice by you. Such technical analysis are believed to be obtained from sources believed to be reliable, but not warrant their respective completeness or accuracy, or warrant any results from the use of the information. Your use of the technical analysis, as would also your use of any and all mentioned indicators, strategies, columns, articles and all other features, is entirely at your own risk and it is your sole responsibility to evaluate the accuracy, completeness and usefulness (including suitability) of the information. You should assess the risk of any trade with your financial adviser and make your own independent decision(s) regarding any tradable products which may be the subject matter of the technical analysis or any of the said indicators, strategies, columns, articles and all other features.
Please also be reminded that if despite the above, any of the said technical analysis (or any of the said indicators, strategies, columns, articles and other features accessible on/through this site) is found to be advisory or a recommendation; and not merely informational in nature, the same is in any event provided with the intention of being for general circulation and availability only. As such it is not intended to and does not form part of any offer or recommendation directed at you specifically, or have any regard to the investment objectives, financial situation or needs of yourself or any other specific person. Before committing to a trade or investment therefore, please seek advice from a financial or other professional adviser regarding the suitability of the product for you and (where available) read the relevant product offer/description documents, including the risk disclosures. If you do not wish to seek such financial advice, please still exercise your mind and consider carefully whether the product is suitable for you because you alone remain responsible for your trading – both gains and losses.

Merck heading down as well. MRKOne more huge pharma firm that is biting the dust. A giant flat with a C wave confirmed. No way but down on this one.
We are not in the business of getting every prediction right, no one ever does and that is not the aim of the game. The Fibonacci targets are highlighted in purple with invalidation in red. Confirmation level, where relevant, is a pink dotted, finite line. Fibonacci goals, it is prudent to suggest, are nothing more than mere fractally evident and therefore statistically likely levels that the market will go to. Having said that, the market will always do what it wants and always has a mind of its own. Therefore, none of this is financial advice, so do your own research and rely only on your own analysis. Trading is a true one man sport. Good luck out there and stay safe.

Merck Co (global health care company) ShortMerck Co (global health care company) Short
Entry price: 91.23
Take profit: 83.21
Stop loss: 95.09
Risk/reward: 2.08

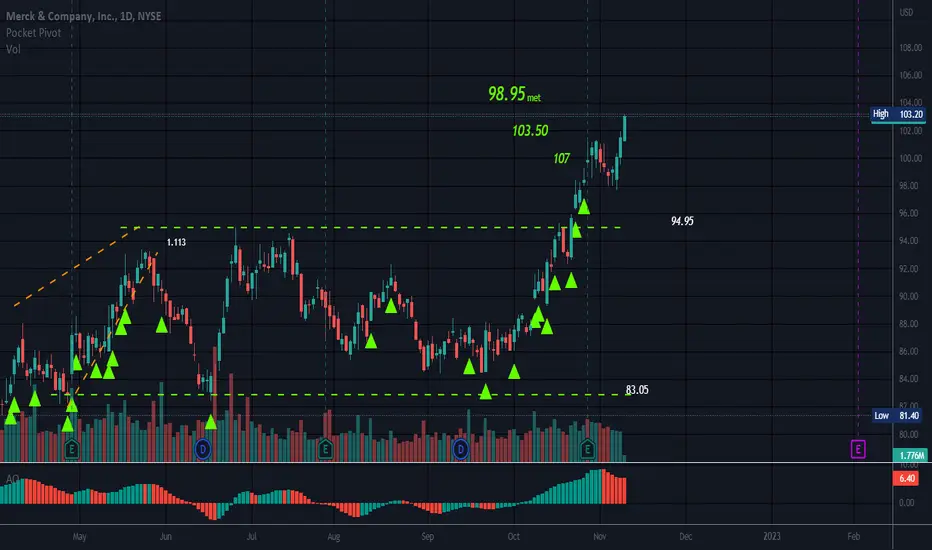
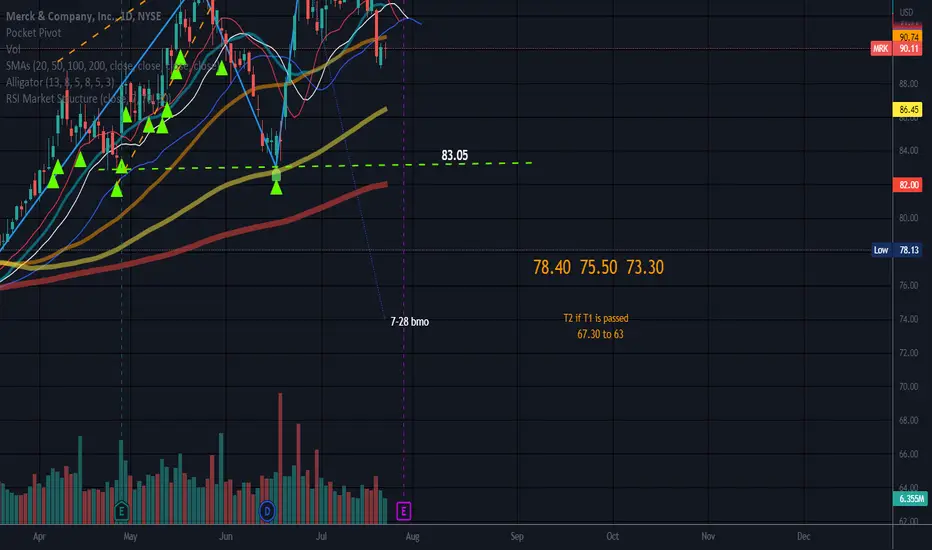
RectangleEarnings 7-28 before market opens.
ATH 96.69.
Horizontal trading channels that is neutral until a trendline is broken with a trend in that direction.
Targets above rectangle are targets to the upside if this were to break that way and vice versa.
If this were to break to the downside this would be a Rectangle Top.
No recommendation/Be safe (o:
Merck did follow the pattern...sort ofIt follows the pattern, but now the base is shifted. I expect it will stay at current level or rise a bit, before dropping after earnings towards the Dividend. If i had any money leftover, i would short it soon after earnings. Unfortunately my put options expired worthless. But that was my fault for buying at the wrong time.

Merck following the pattern....but the base has shiftedMerck definitely follows this pattern, but now the dam bottom has shifted to a higher plateau...my PUTS are just under this base, i think they will expire worthless, unless some massively bad news drops the stock back to the previous base.

Just like the last 4 or 5 dividends events....Just like the last few, Merck stock dropped as it approached the dividend. My only problem was it did not drop enough....my puts are the light blue lines. I guess we will see if the stock drops more enough for me to sell or if it goes up and does the pattern again.
